Chatbot Performance
What is Chat Automation Analytics?
Chat Automation Analytics shows all the data regarding the performance of your Automations.
Why use Chat Automation Analytics?
Chat Automation Analytics helps you better understand your customers' needs and how exactly they interact with your chatbot.
How to access Chat Automation Analytics?
To access Chat Automation Analytics, go to the Analytics > Overview > Chat automations section from the navigation bar.
Chat automations Overview
In this section, you can analyze data regarding the performance of your chatbot. Analytics allow you to get insight into how is your chatbot performing, providing answers to questions about Traffic, Automated Engagements, Helpfulness, Automations, etc.
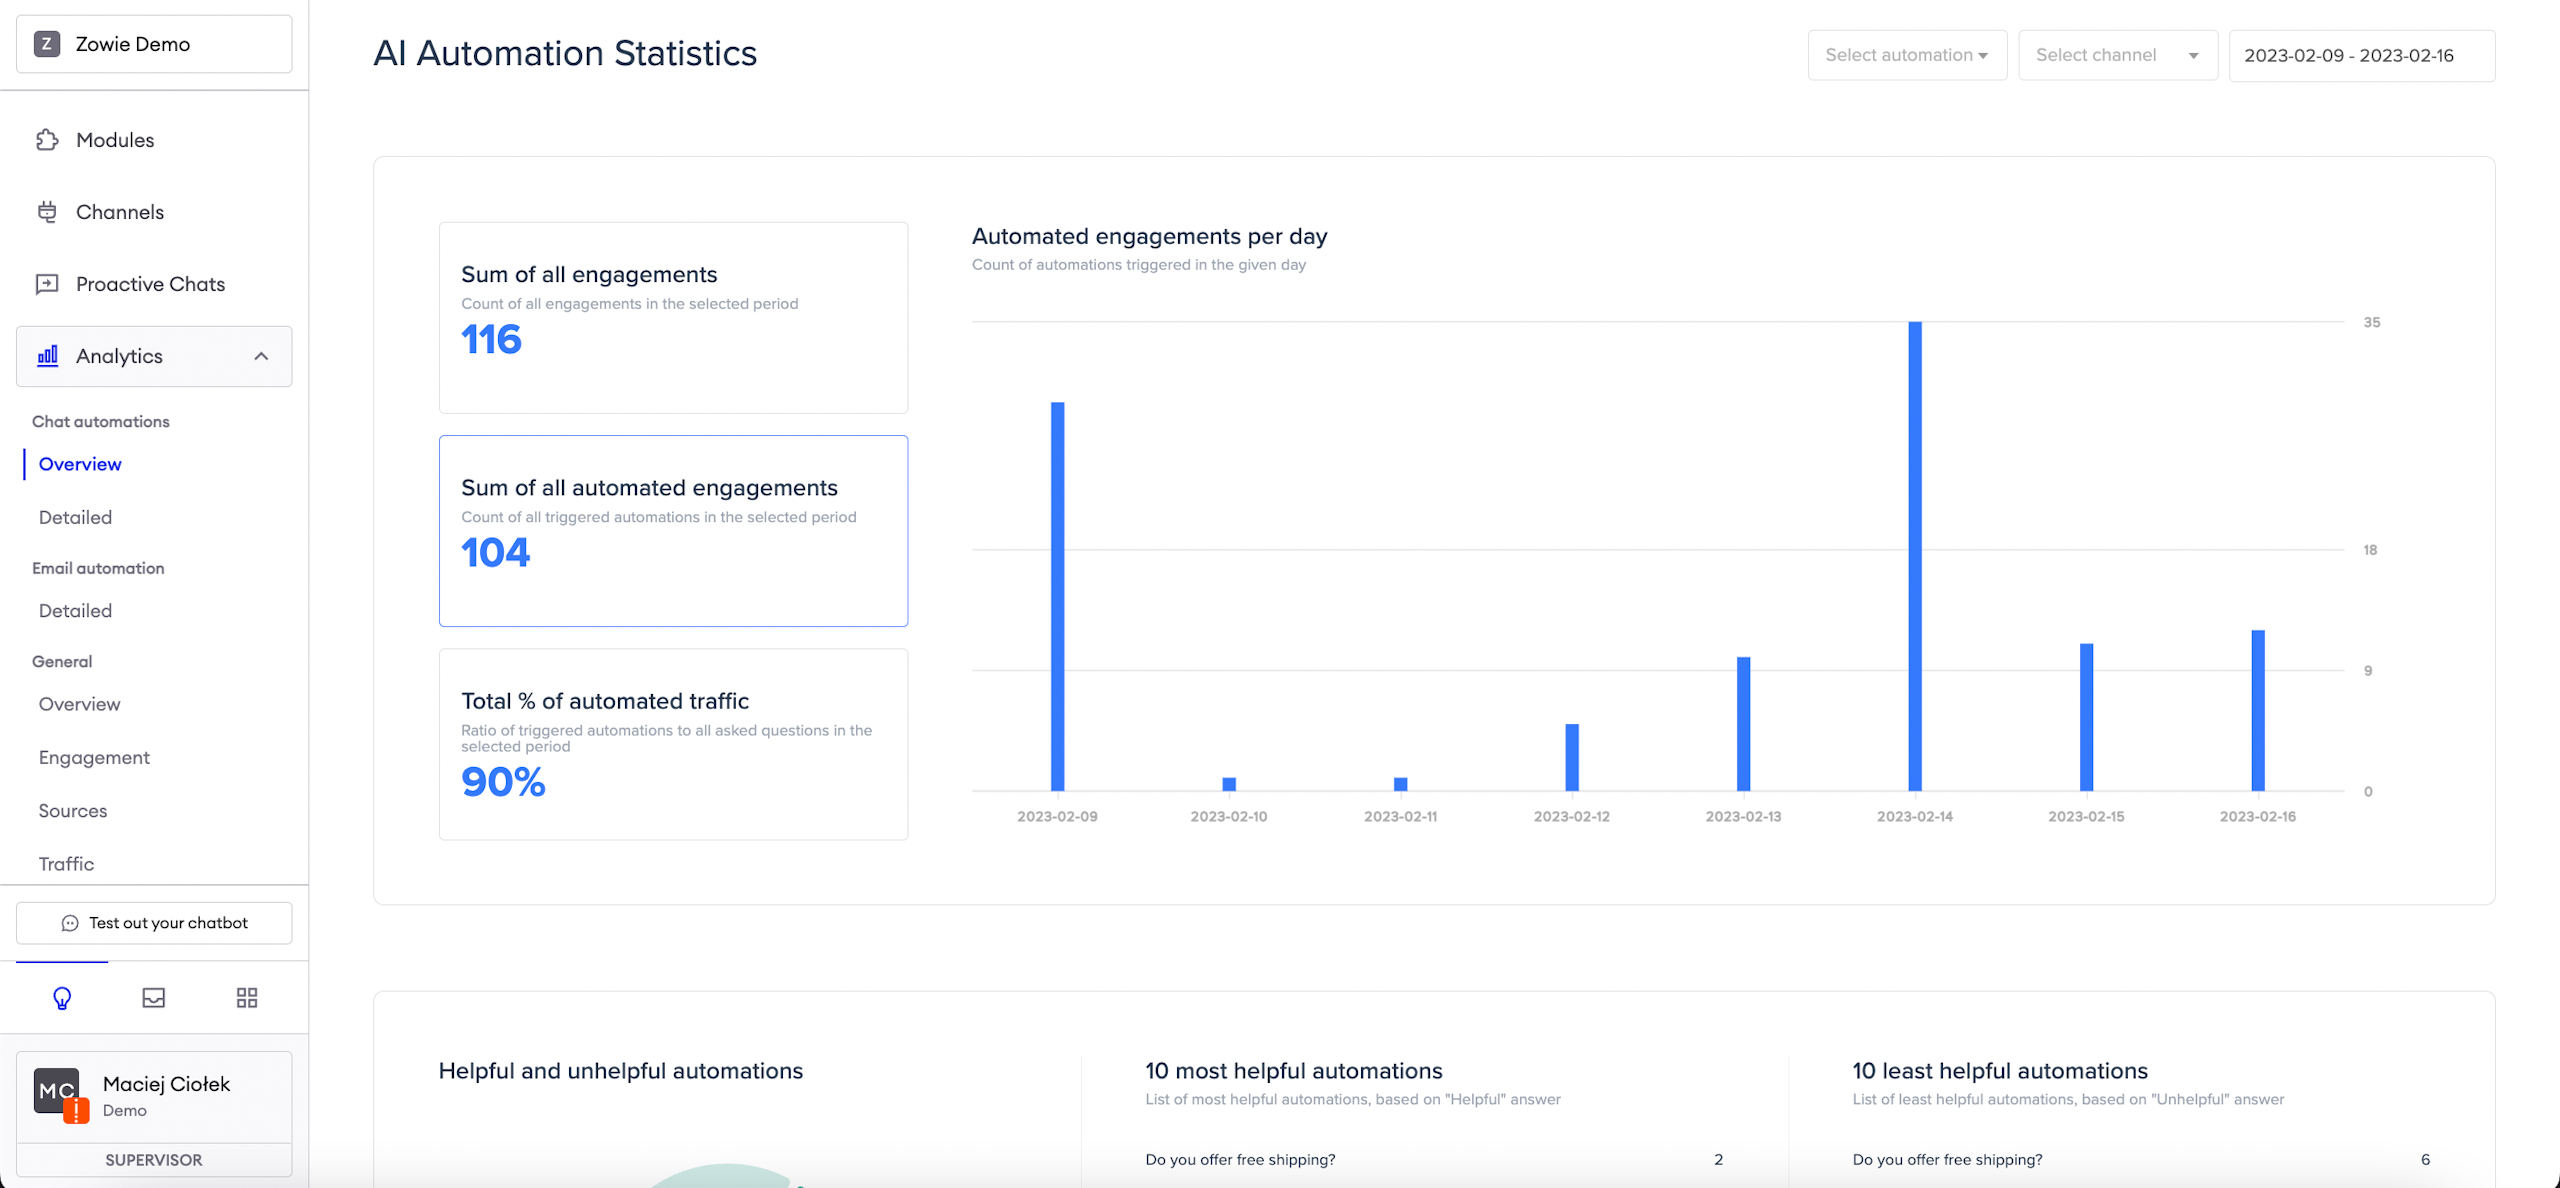
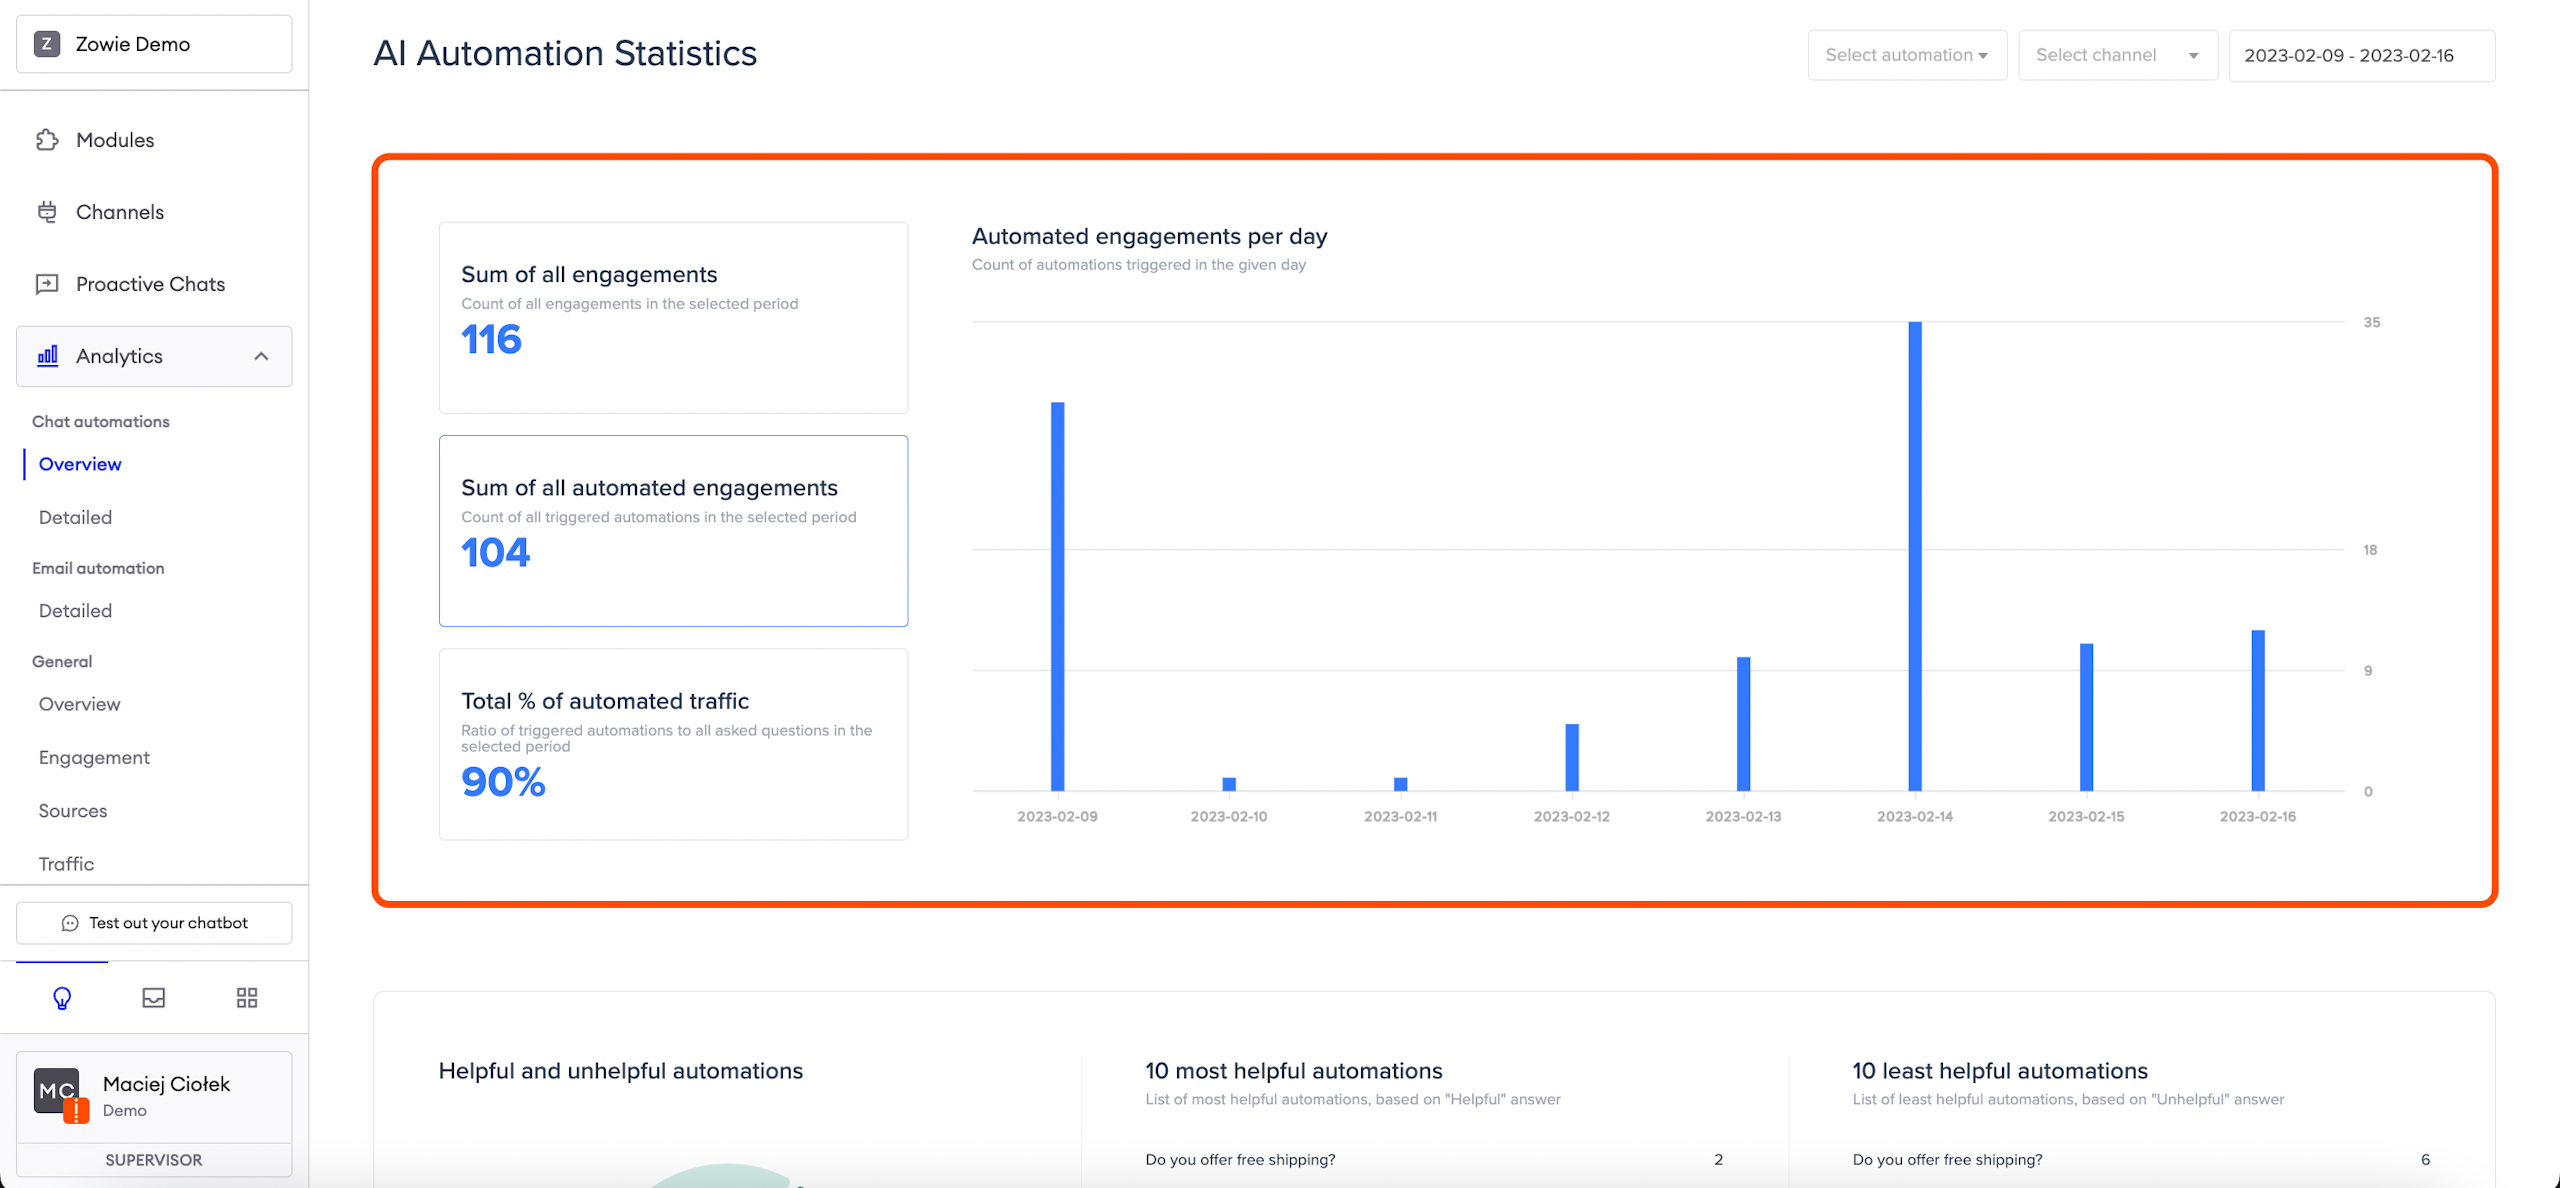
Automated engagements
The first section in Chat Automations Overview provides information about:
The number of all engagements: It displays data from all channels, which can be filtered using the list to the left of the period selection.
The number of all automated engagements: which means, that the chatbot recognized the user's intention and responded with an automatic answer.
The total percentage of automated traffic: the ratio of all triggered automations to all asked engagements.
To the right of the above, you will be seeing a graph that represents the data of the fields that you click at.
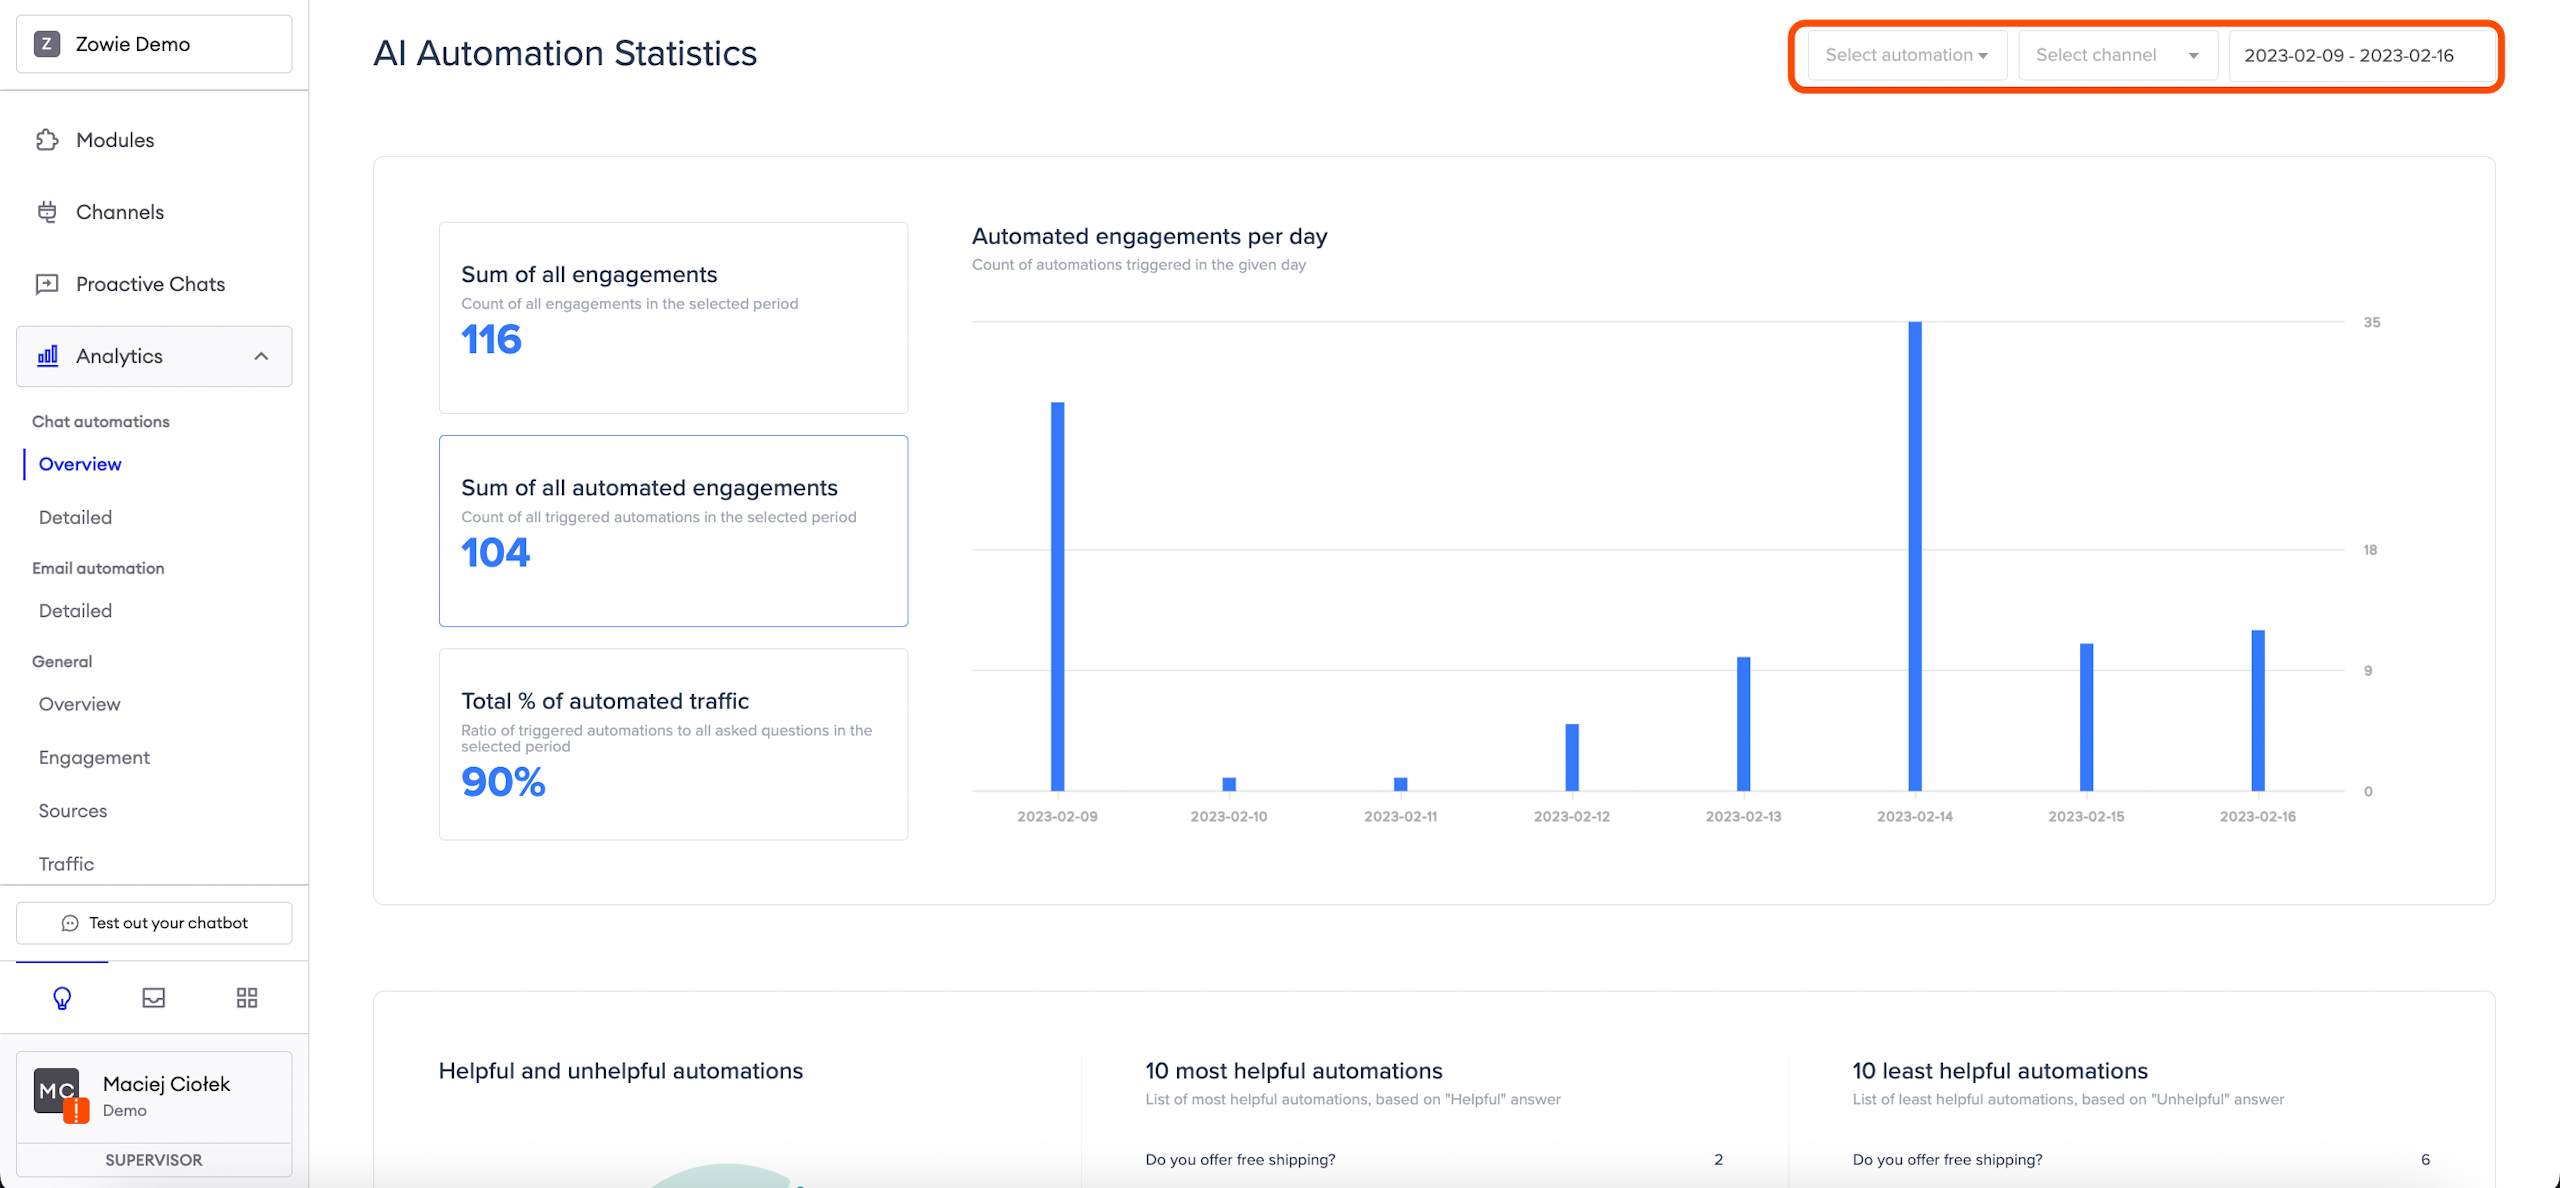
Data selection
Not only can you select the time slot & channel, but also the exact Automation and see the detailed statistic for it, which will be explained later in this article.
If you choose one channel you will be seeing the statistics of this Automation only in regard to one, picked channel.
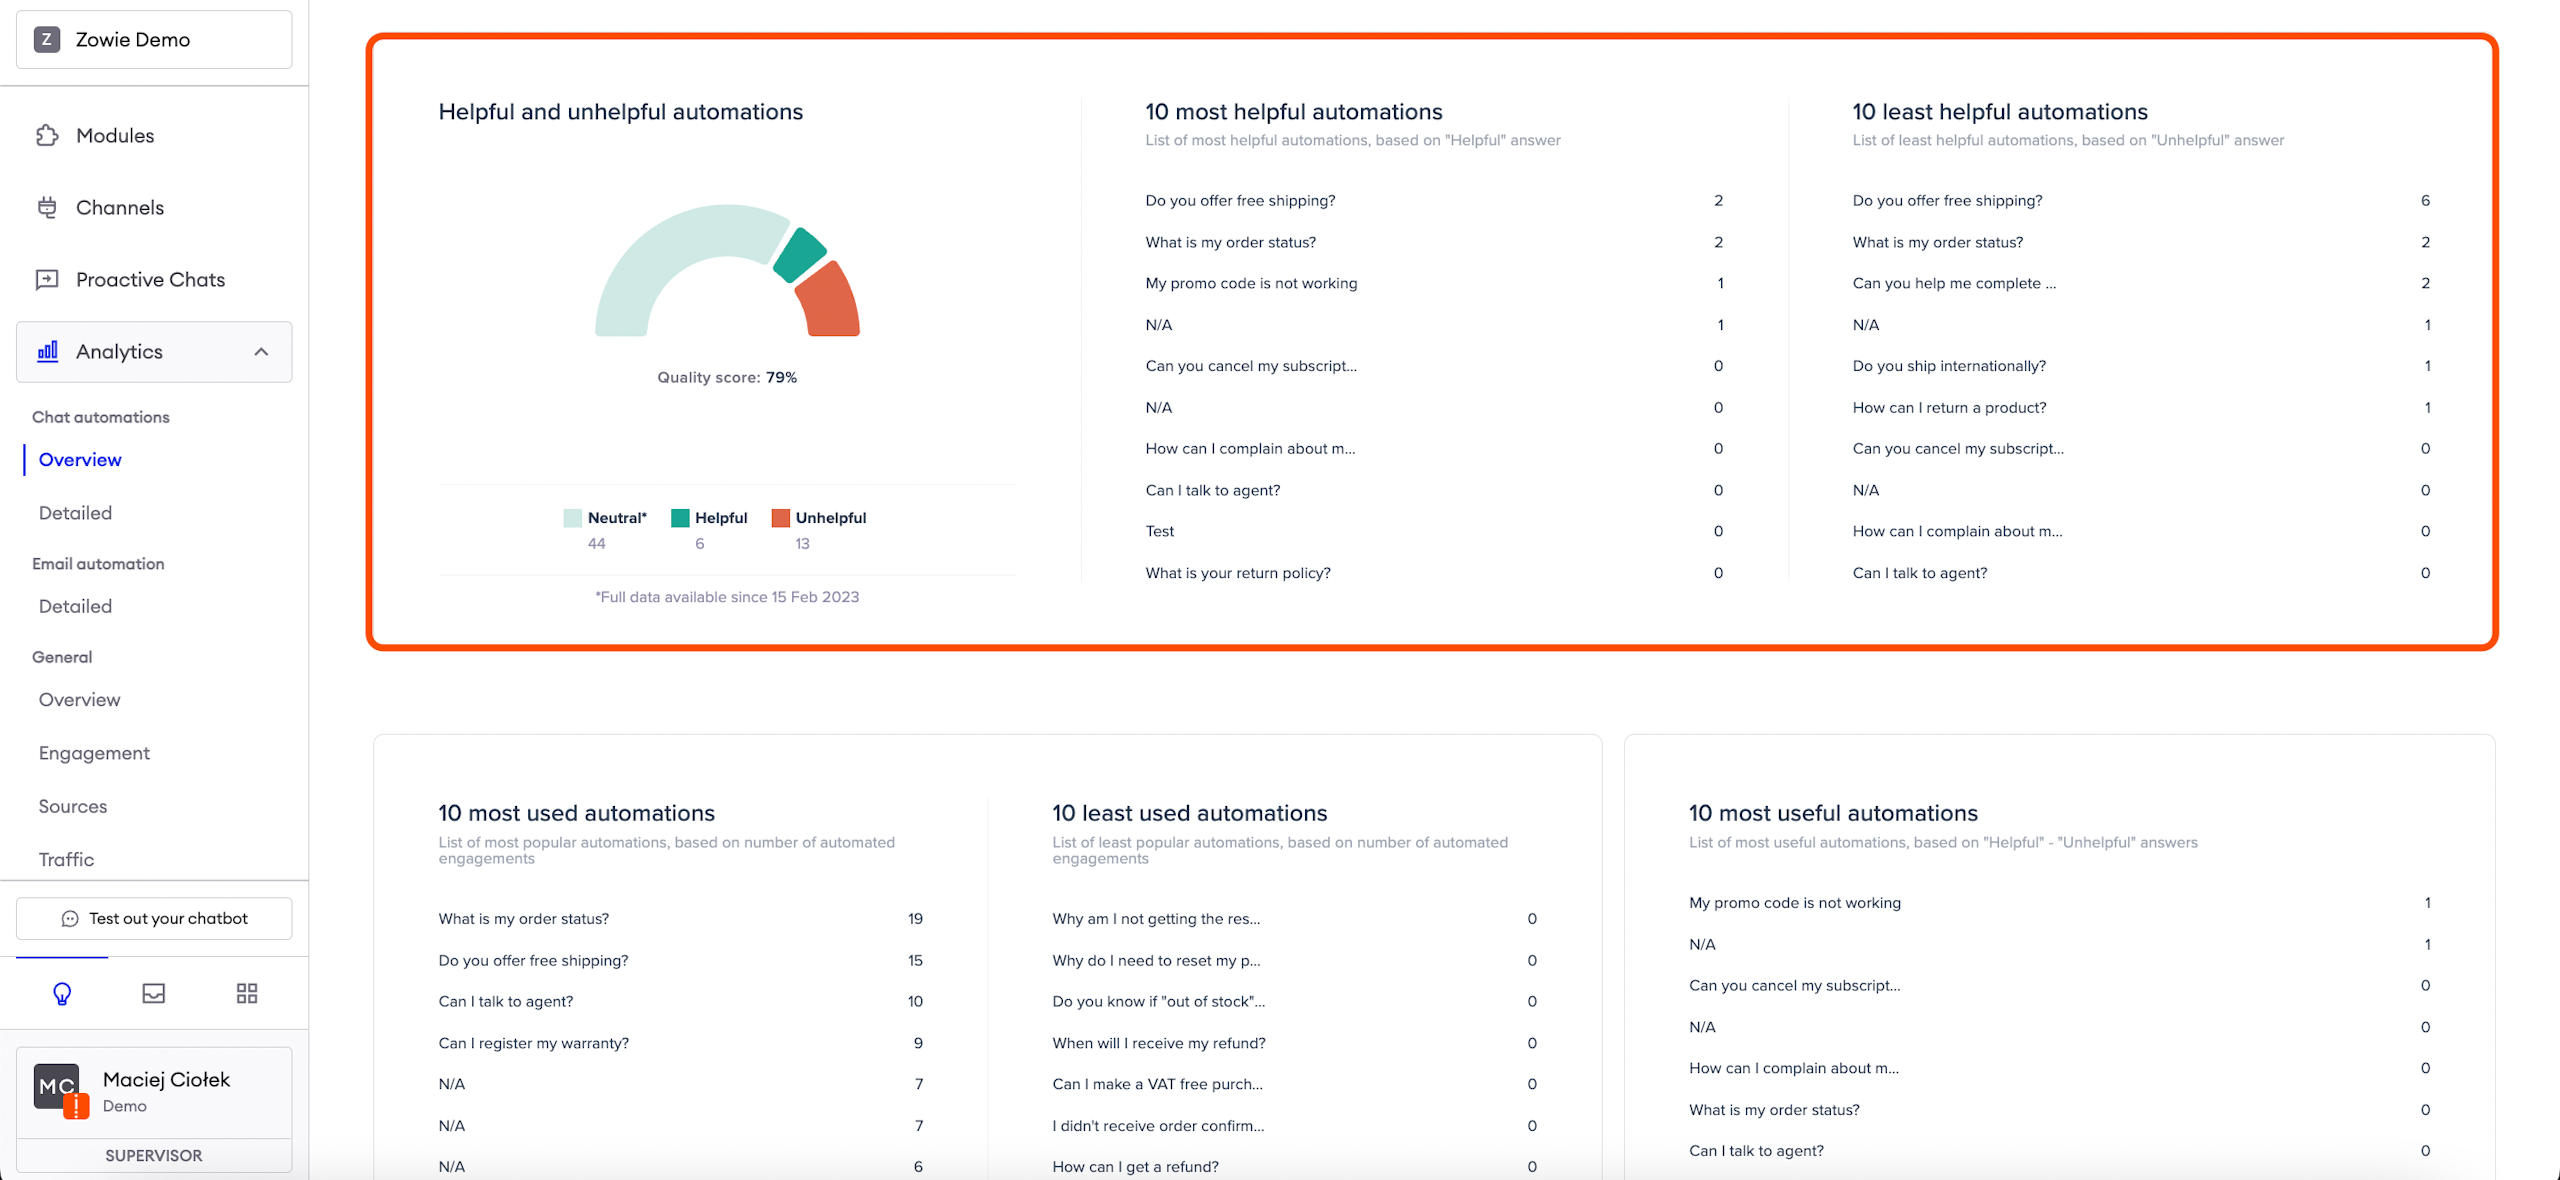
Quality Assurance
The second section is related directly to Quality Assurance. If you want to know more about QA, please check here. In this part, you’ll find a pie chart that shows how many Automations were rated as helpful, or unhelpful and for how many the user decided to skip the answer to the QA question (Neutral).
Quality Score counts those who were positive and neutral about the experience. This allows you to better understand your end-user experience in relation to automation scenarios you build with Zowie.
To the right of the pie chart there are two lists: one that shows the 10 most helpful automations, so the Automations that the customers are satisfied with, and one that shows the 10 least helpful automations.
10 most helpful automations: in this field, you will be seeing those Automations that were rated as helpful (in this part we do not count yet how many times it was rated negatively) in the selected time frame.
10 least helpful automations: in this field, you will be seeing those Automations that were rated as unhelpful (in this part we do not count yet how many times it was rated positively) in the selected time frame.
Once you click on the title of the Automation, you will be able to see detailed information about the given Automation.
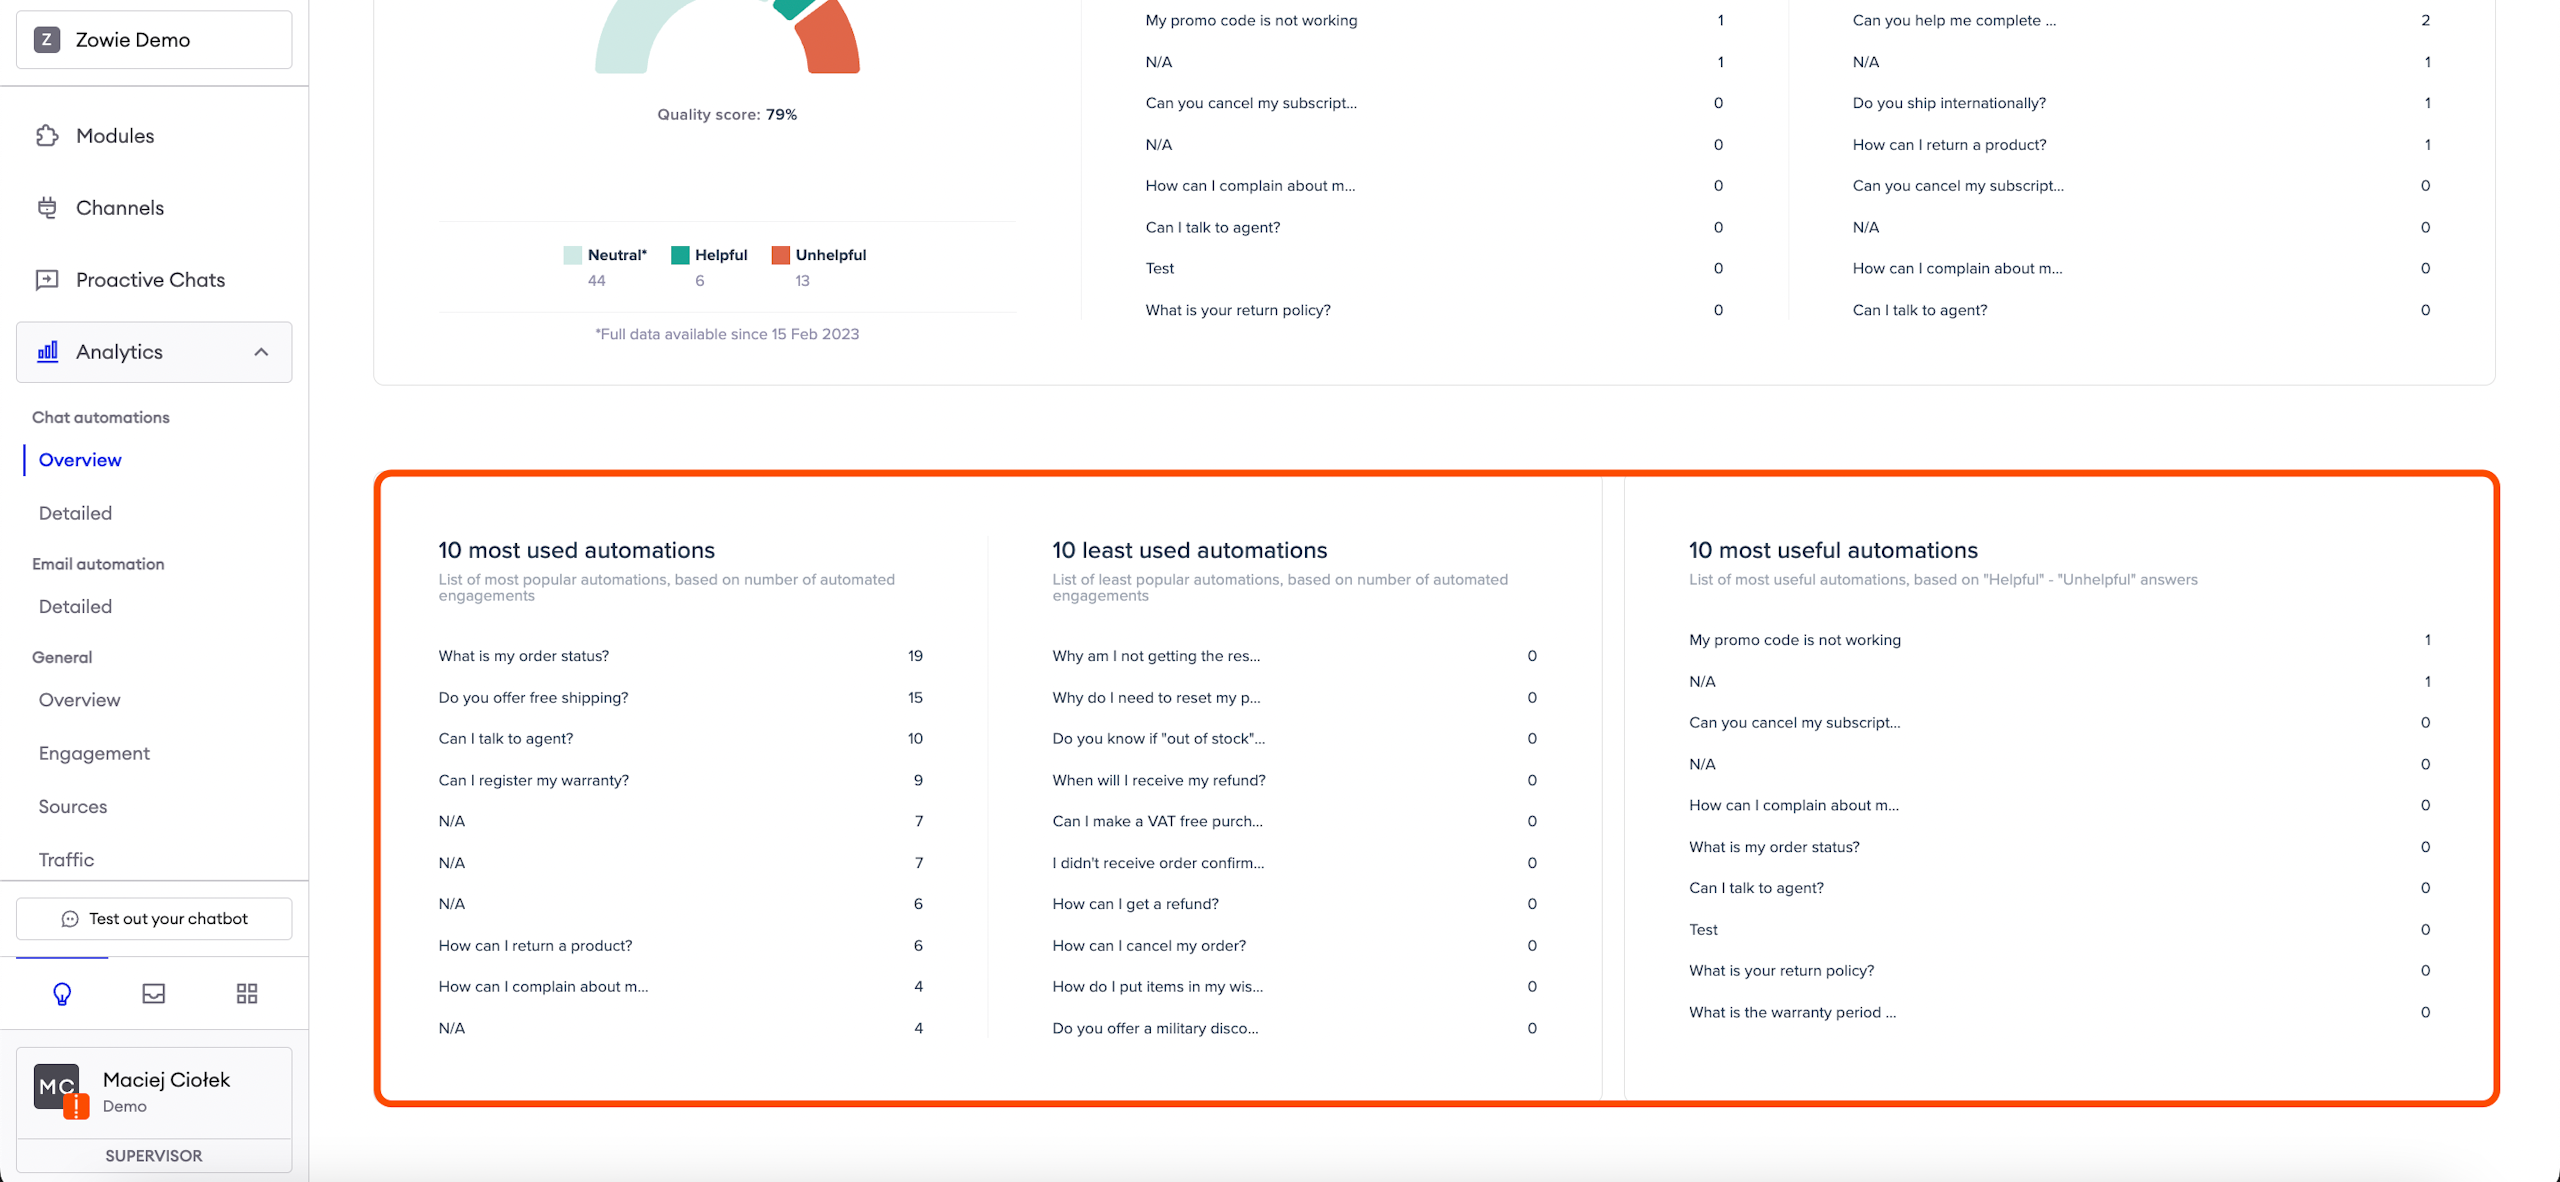
Usefullness
The third section shows you three lists:
- 10 most used automations;
- 10 least used automations;
- 10 most useful automations.
The first two of those lists allow you to get insight as to which Automations are used frequently, and which are not used at all or very rarely.
The third list shows you Automations that are most useful to the customers, based on their Usefulness coefficient (The Usefulness coefficient is calculated by subtracting the amount of helpful answers from the amount of unhelpful answers).
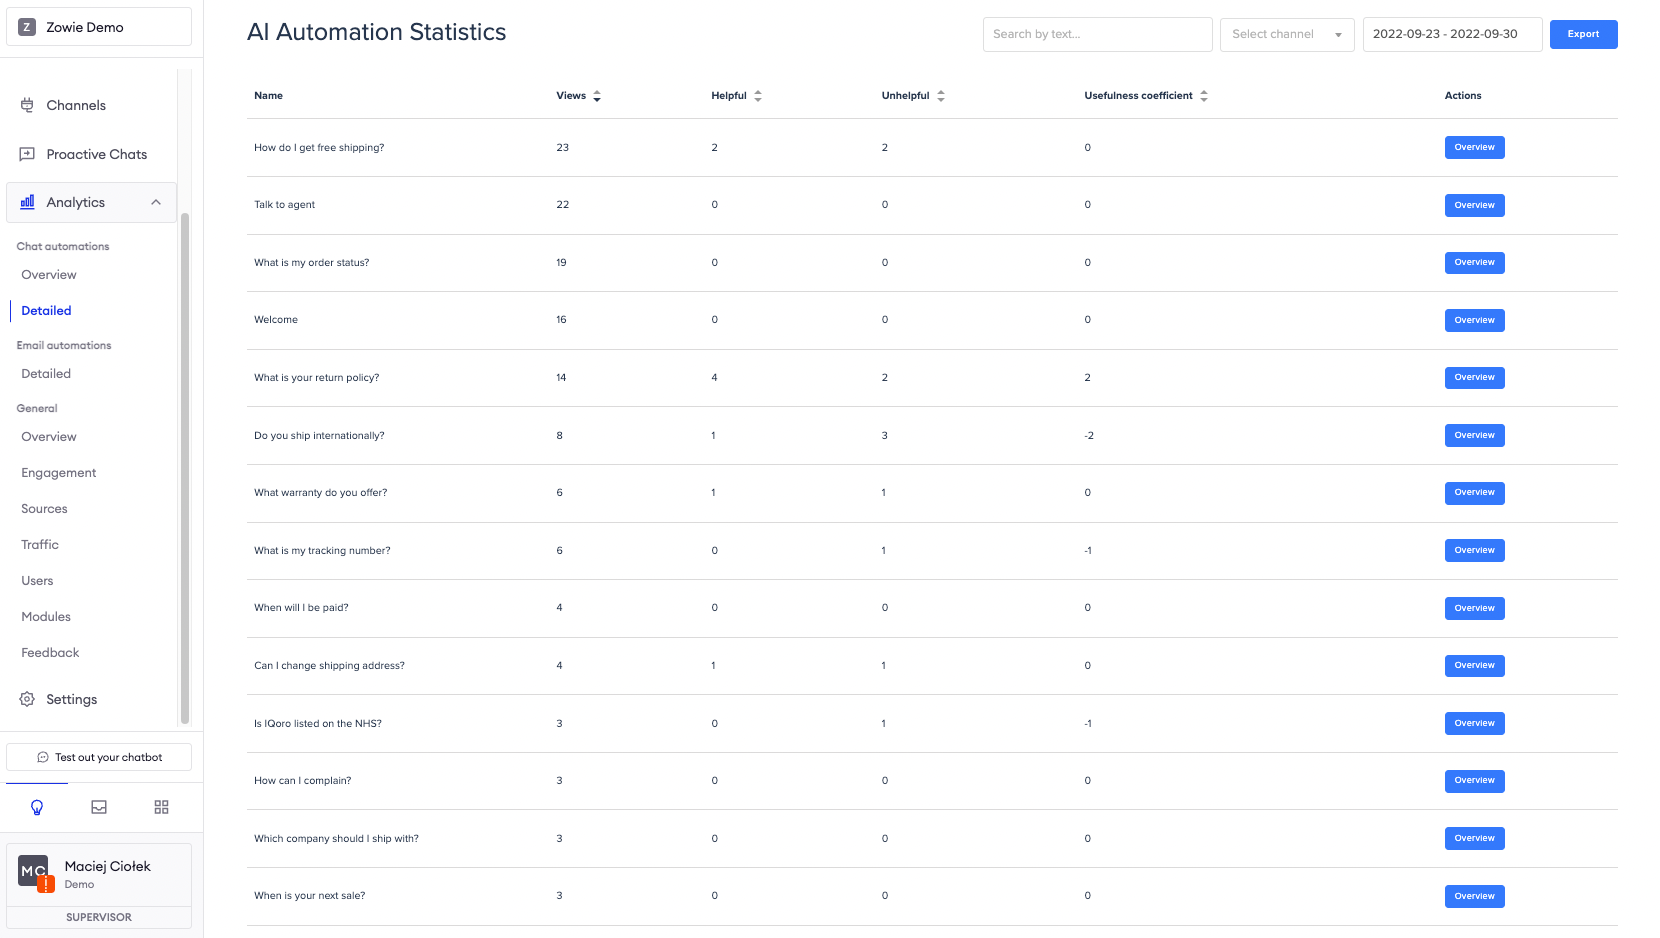
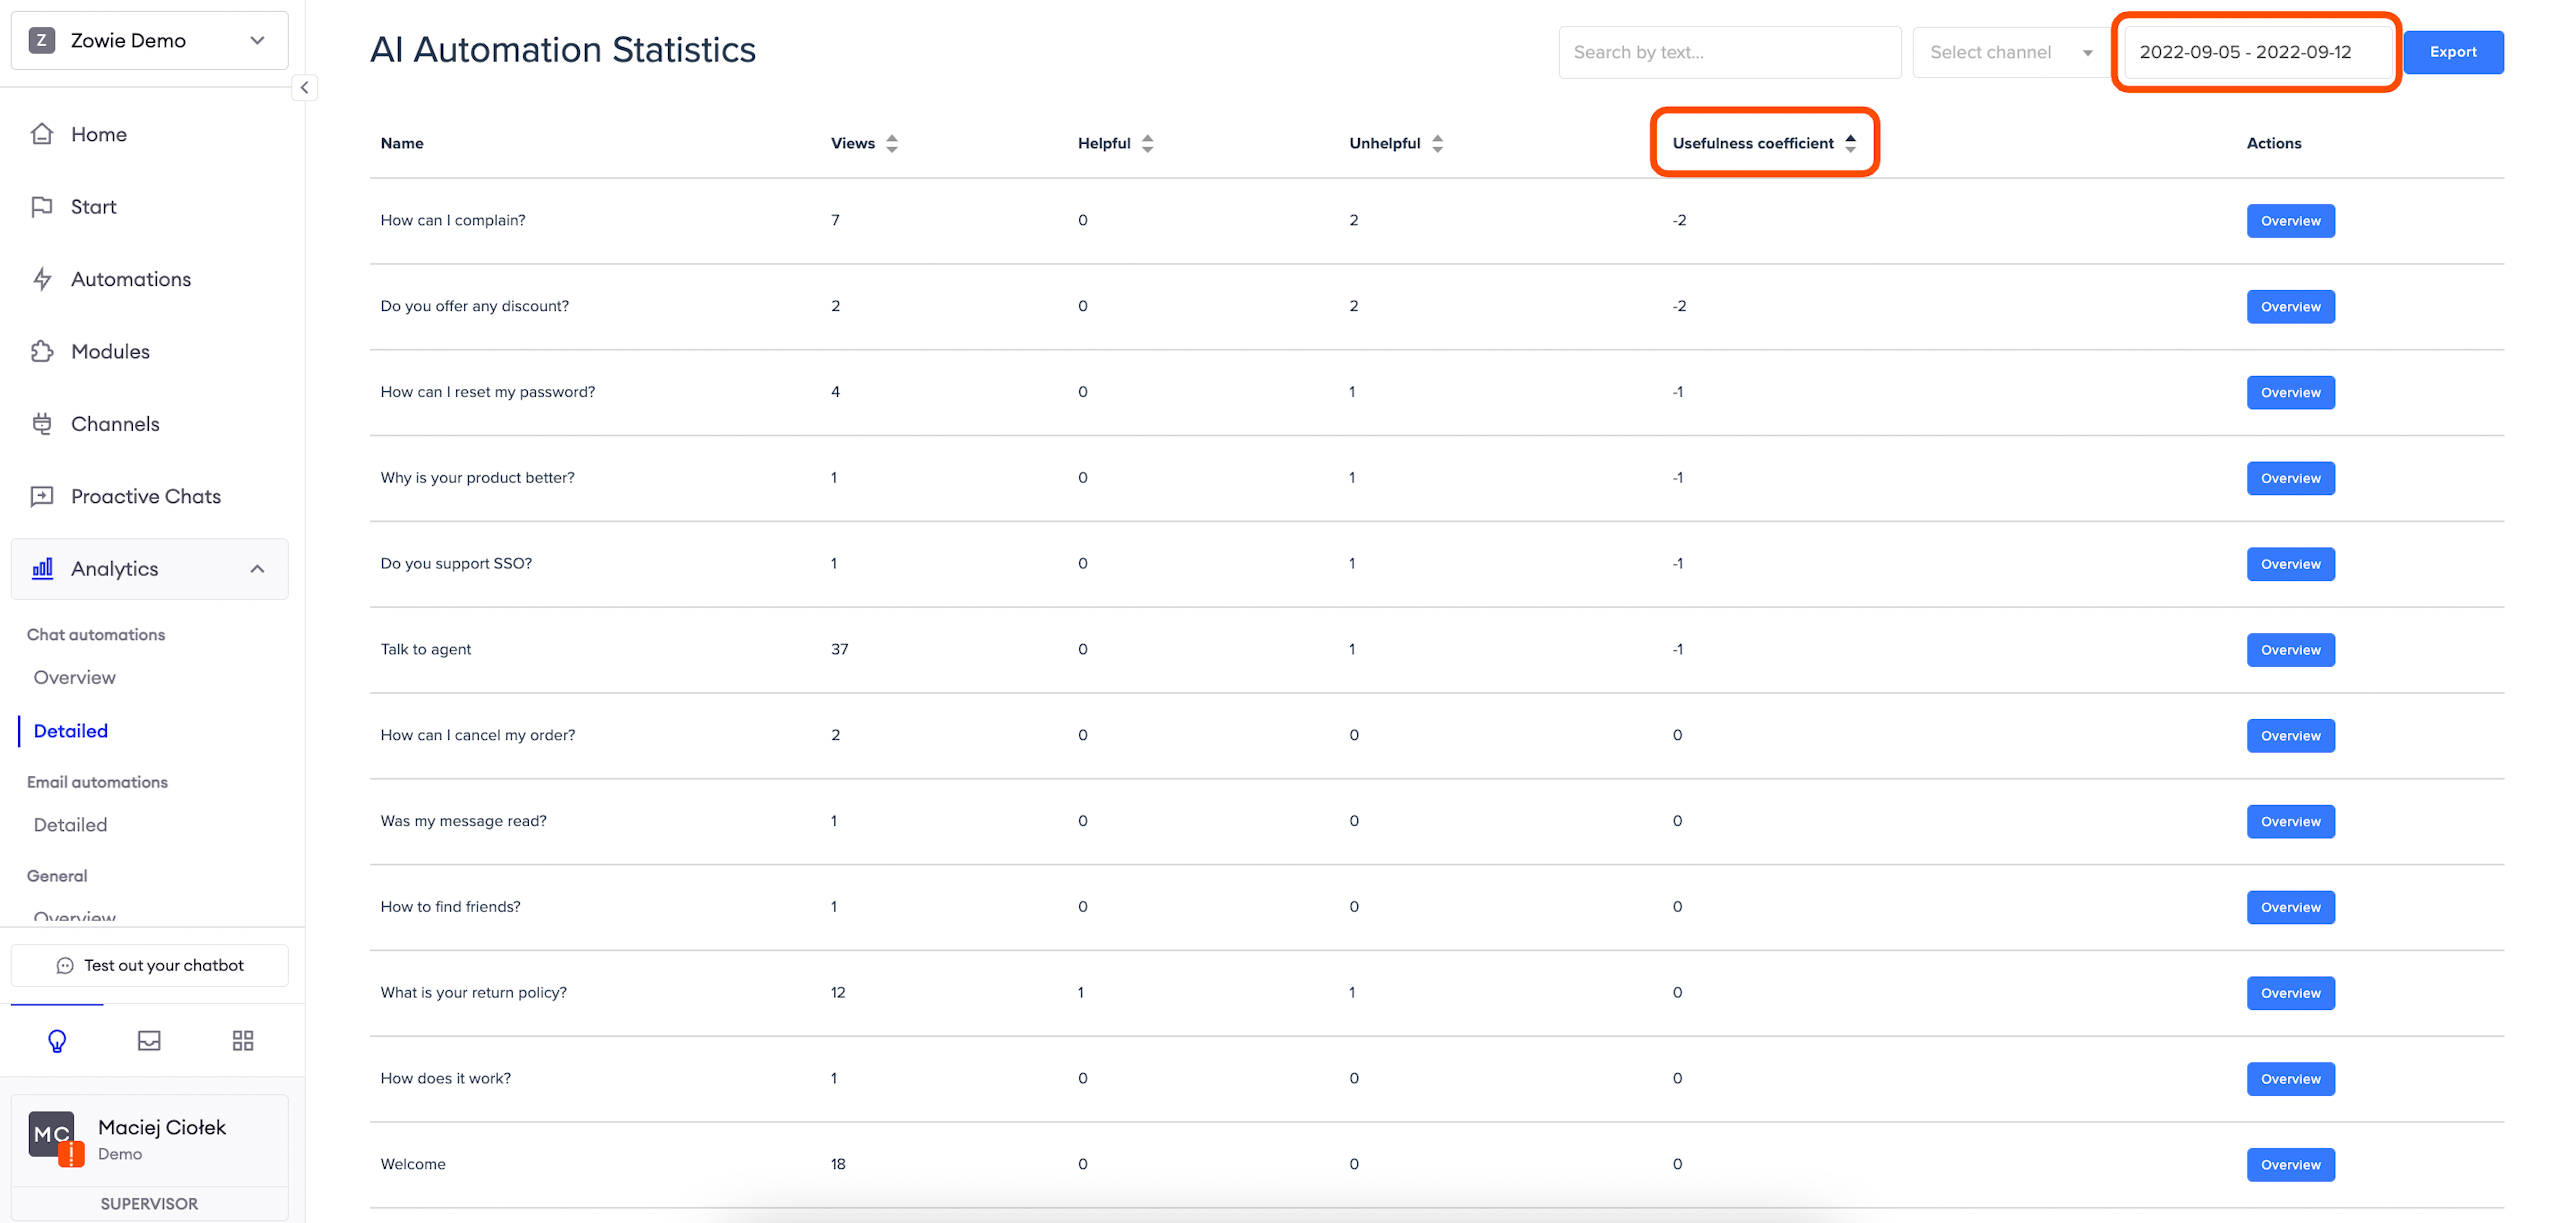
Detailed view of chat automations
The Detailed view displays a list of all Automations in your Knowledge Base, including the number of invocations in the selected period (Views column), how many Helpful reactions did the automation get, as well as how many Unhelpful. Finally, there is a Usefulness coefficient calculated using the Helpful - Unhelpful formula.
Here you can also filter by the Channels and search for keywords, eg. order.
If you are interested in checking the worst-rated Automations, please click the upper arrow next to the Usefulness coefficient.
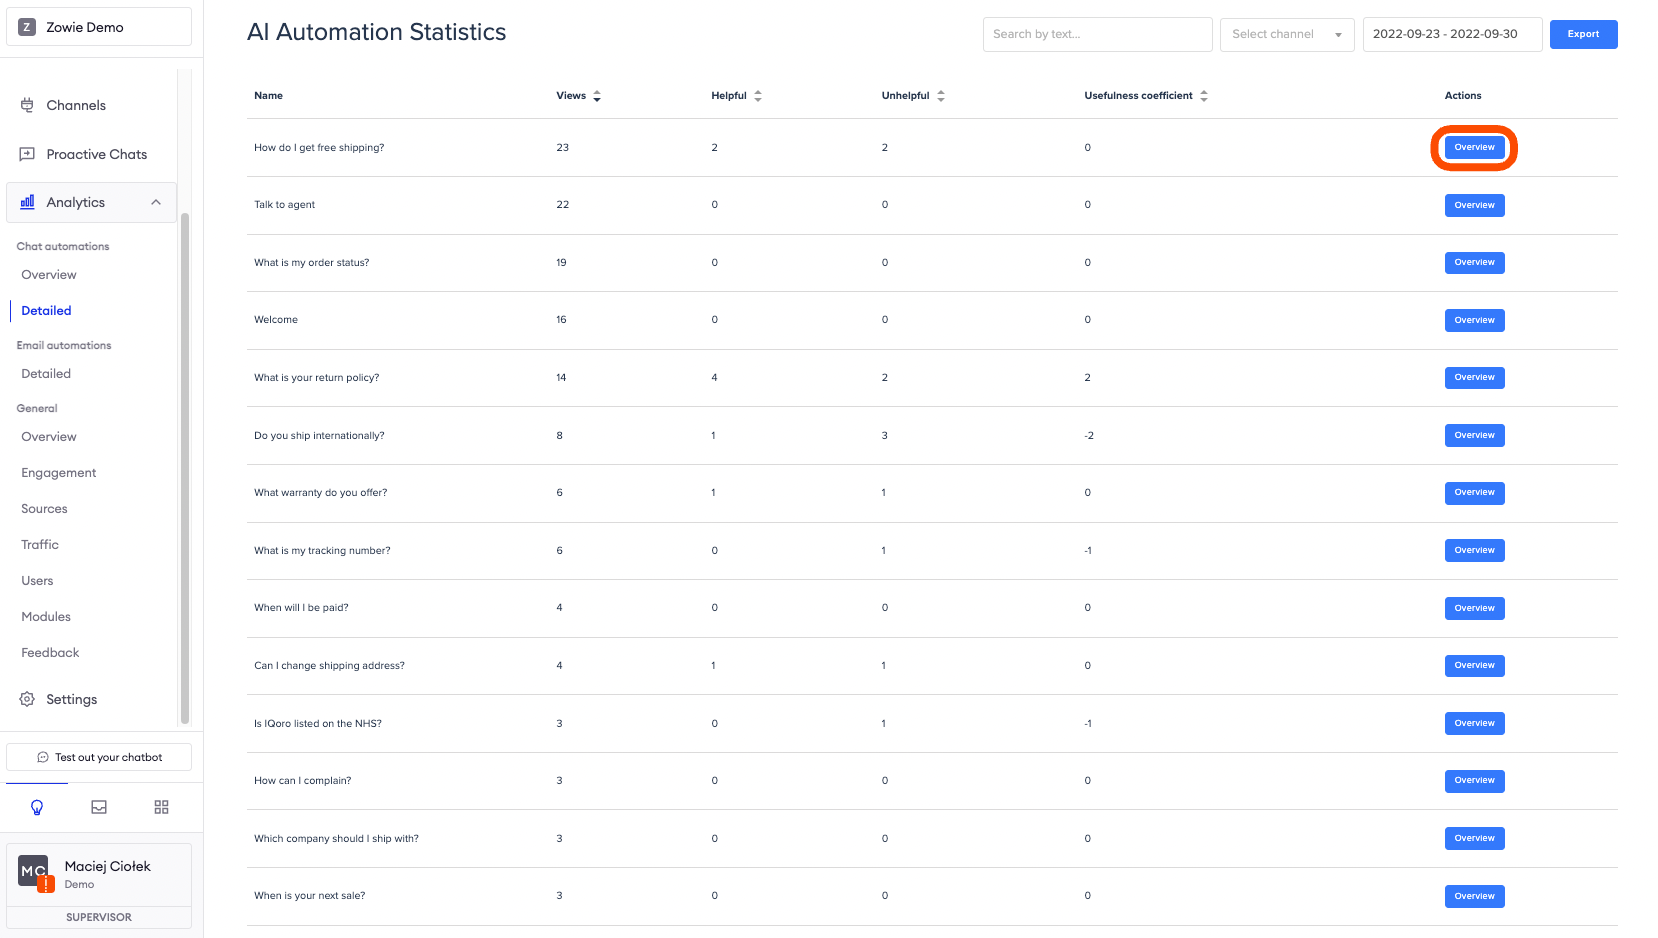
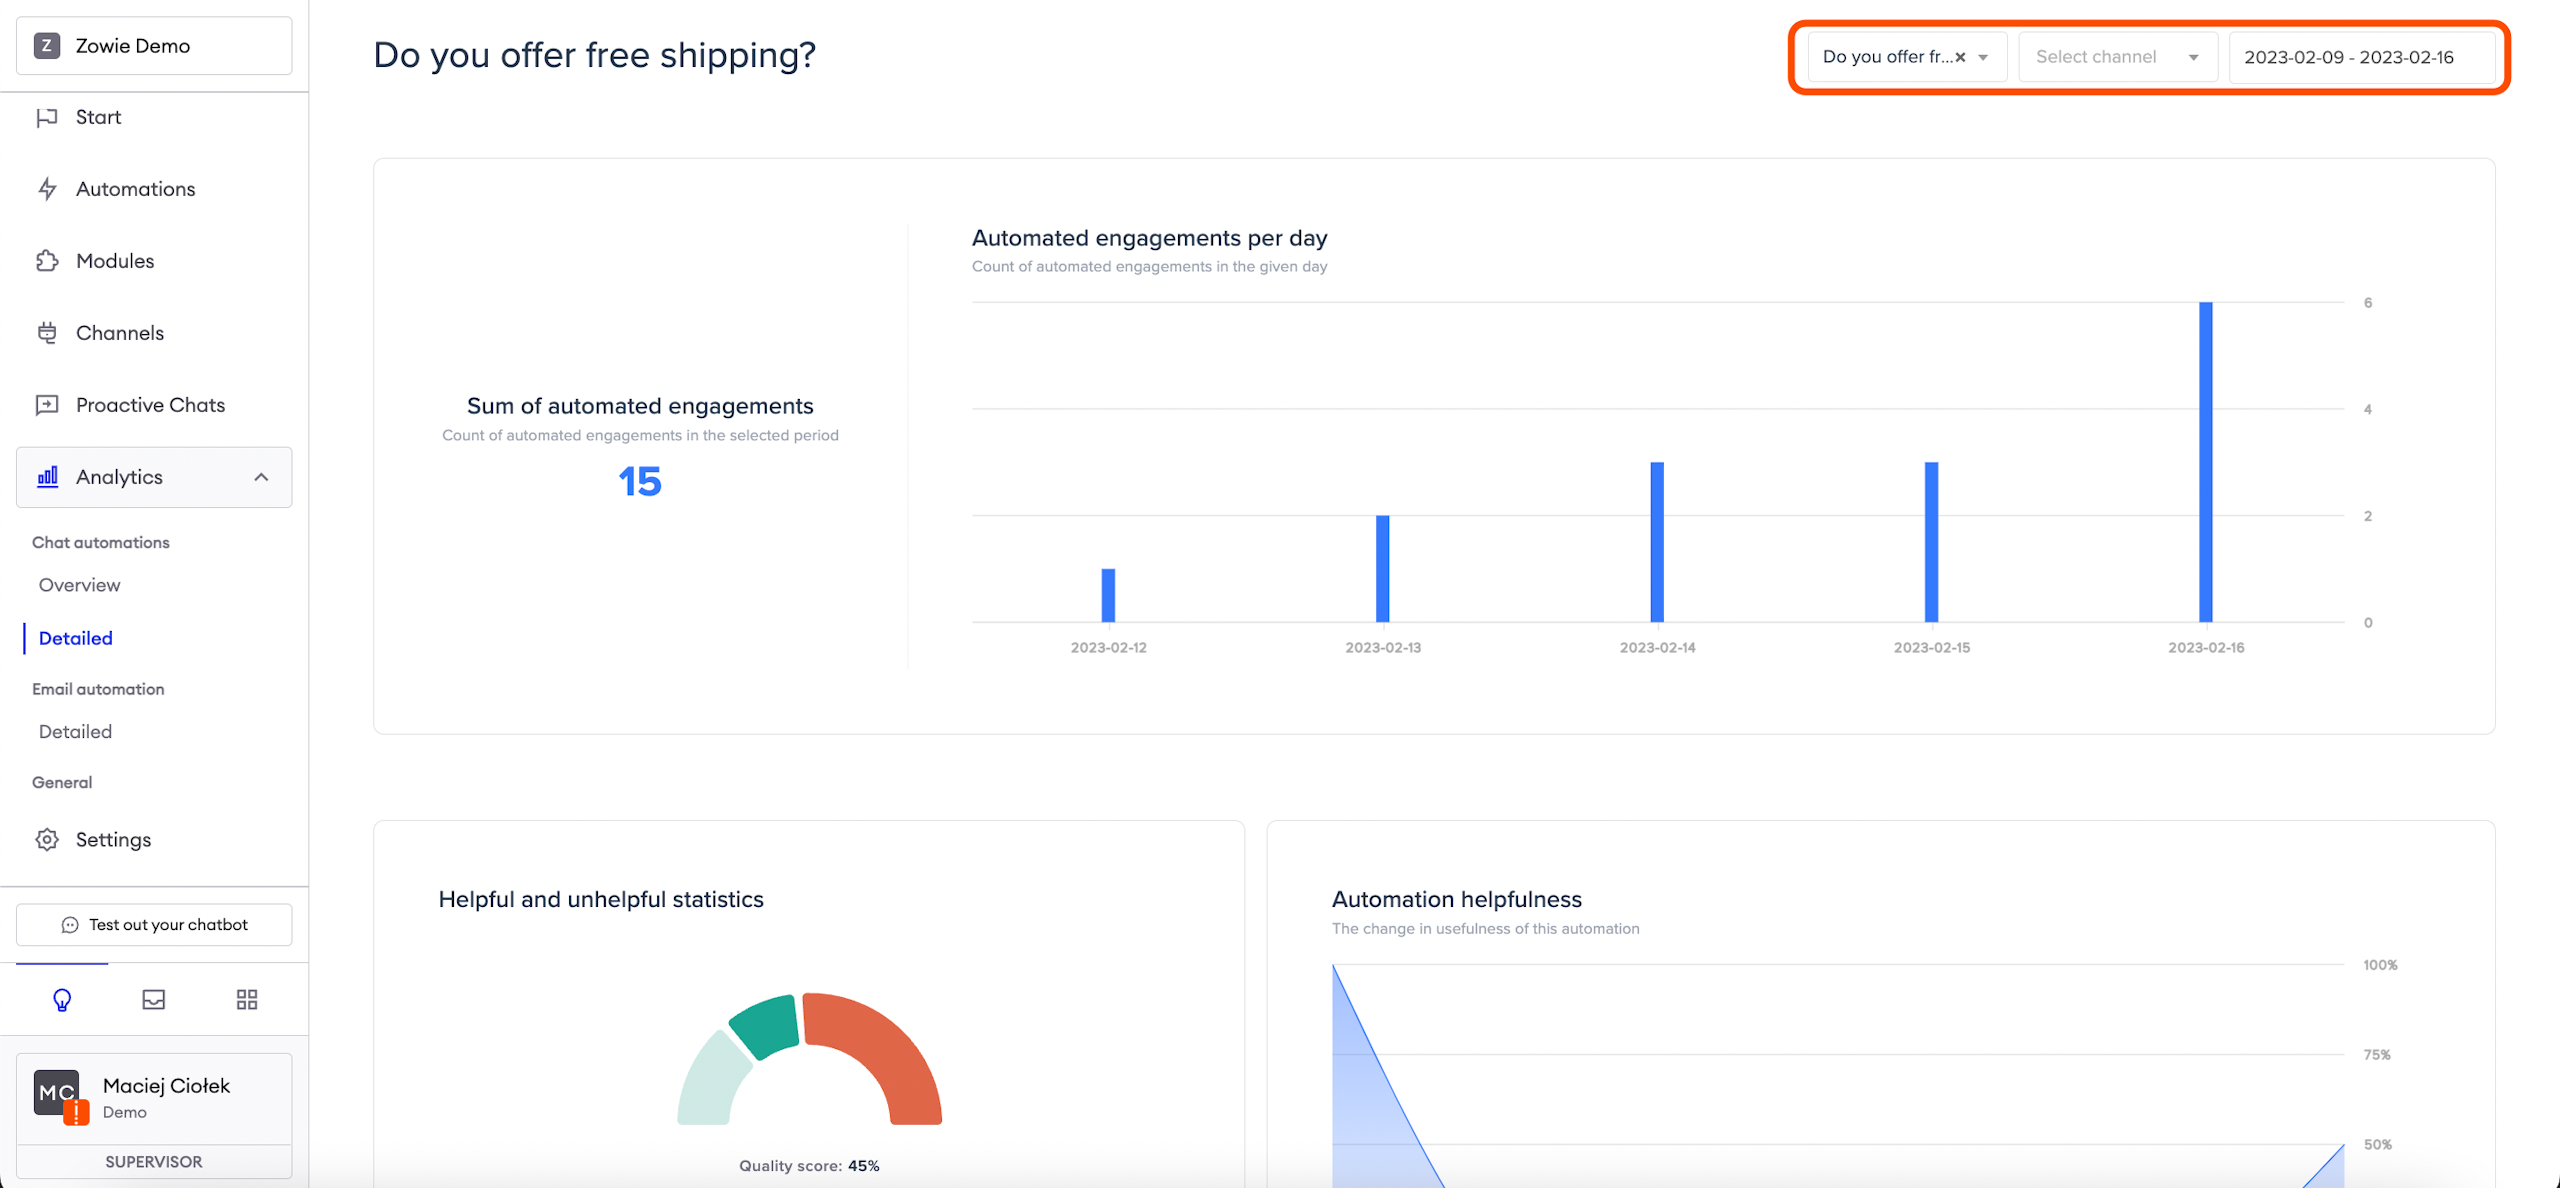
Engagements
Once you click on the "Overview" button in the Automation list view, you will be able to see detailed information about the given Automation.
The first graph allows you to see how many times the selected Automation was triggered in the selected period.

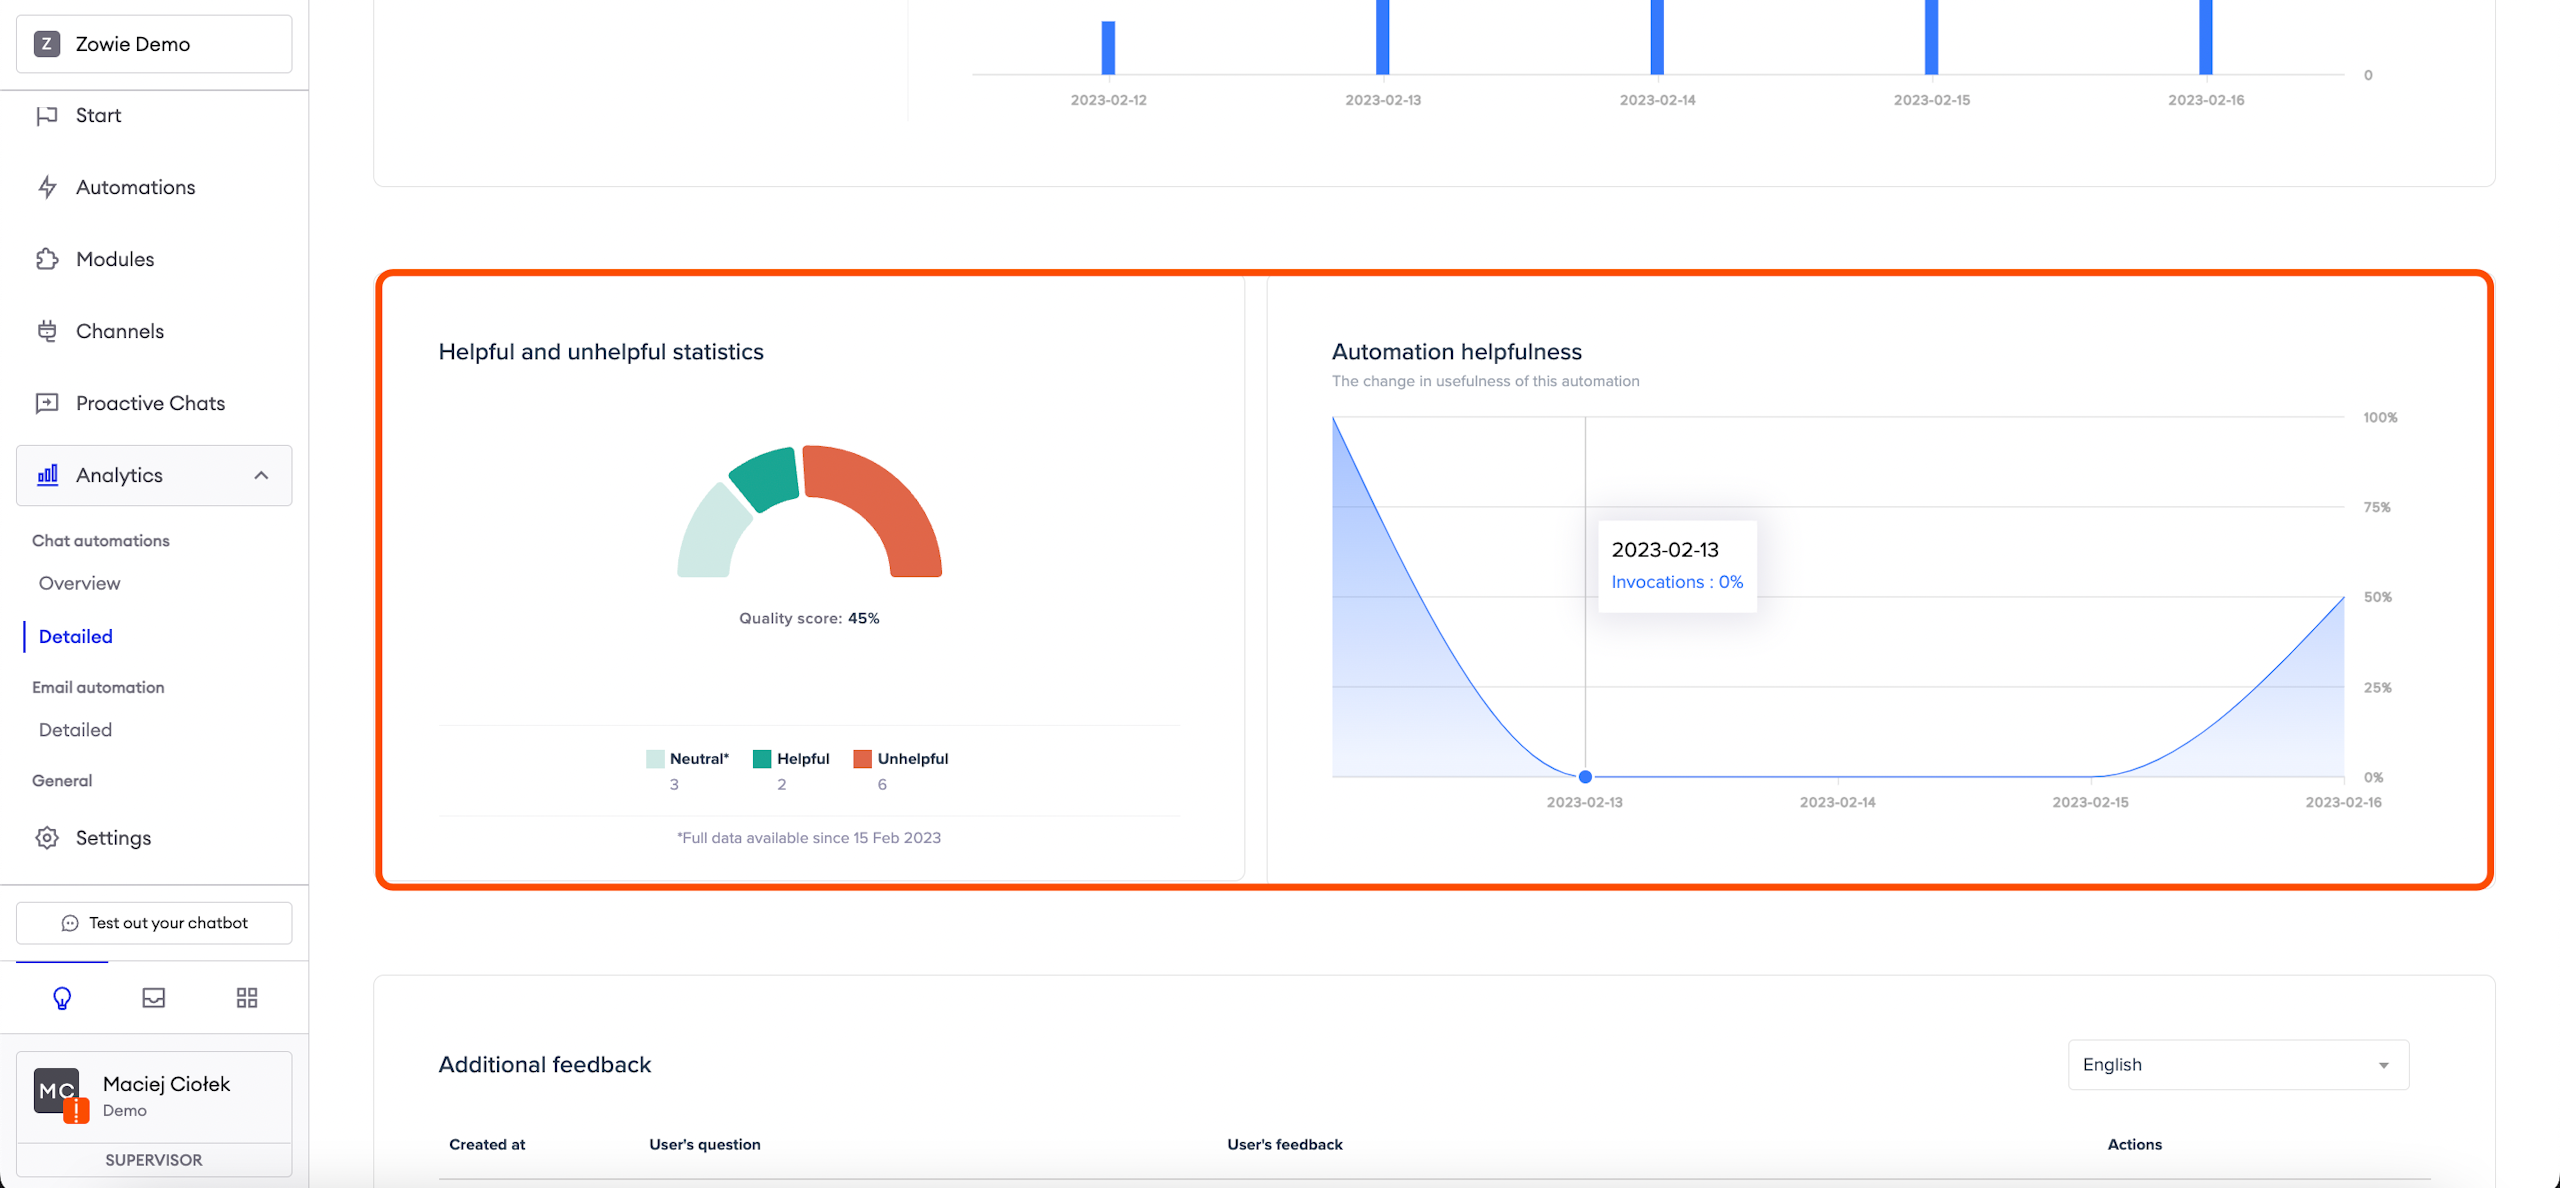
Helpfulness
The second graph allows you to see how many users rated the given Automation as Helpful, or Unhelpful, and how many skipped the Quality Assurance question (Neutral). Additionally, you will be able to see the Automation's usefulness on the graph to the right.
Quality Score counts those who were positive and neutral about the experience. This allows you to better understand your end-user experience in relation to automation scenarios you build with Zowie.
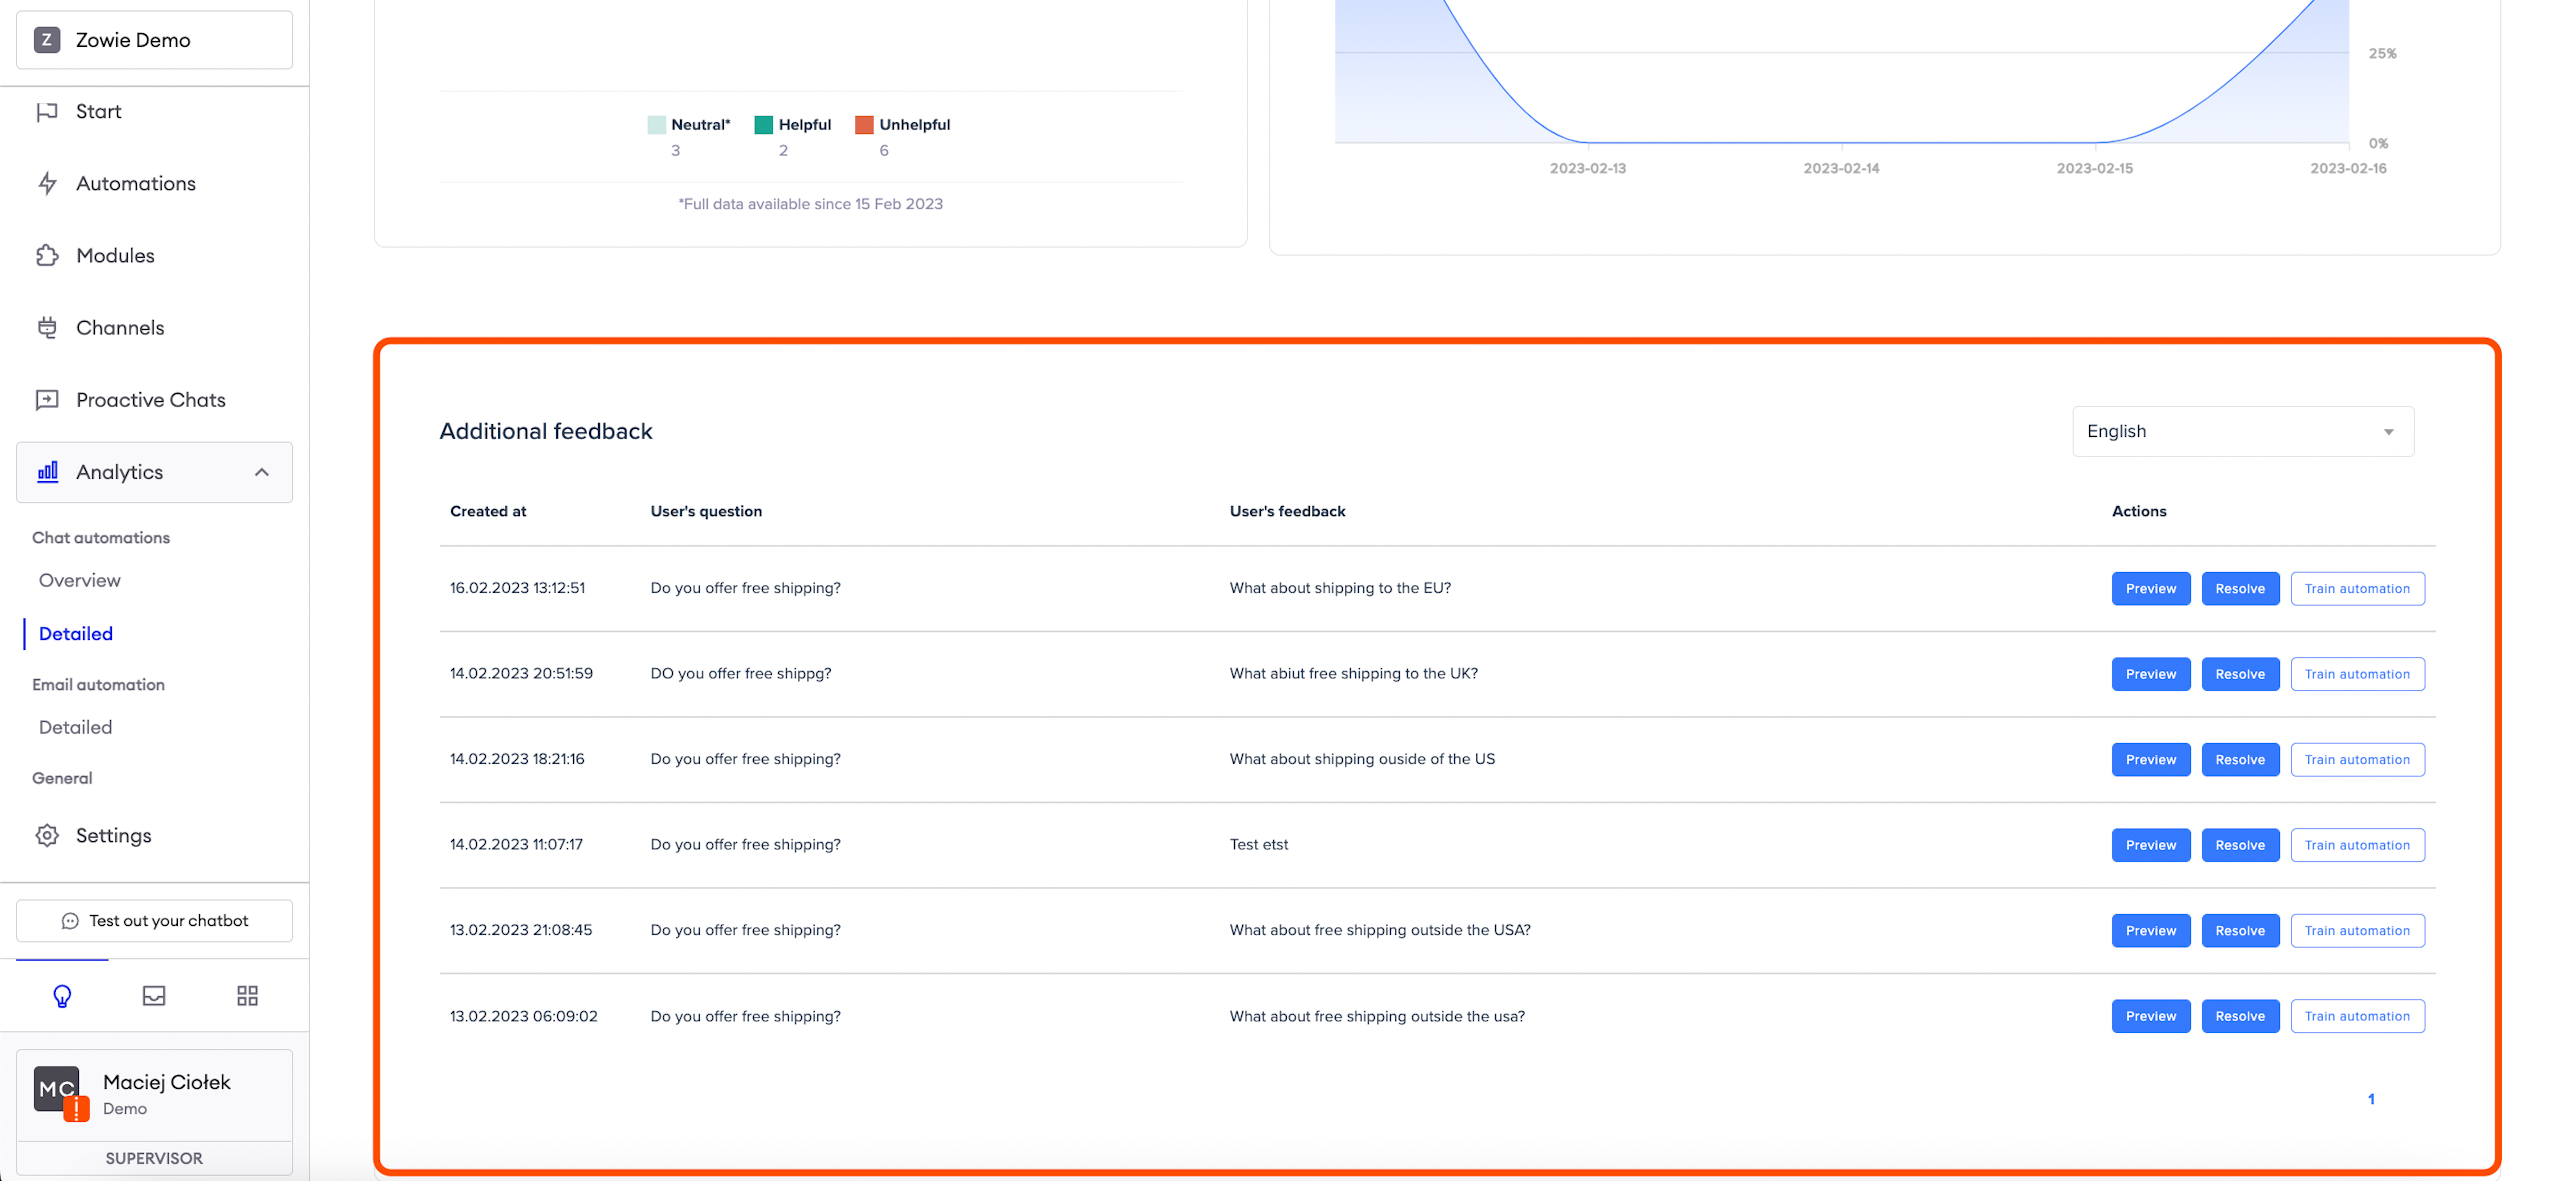
Quality Assurance Feedback
Finally, if you're collecting feedback with the Quality Assurance feature, then you will be able to see and review the feedback from your customers here.
The Analytics view is particularly useful for improving chatbot performance. It’s good to check this section on a regular basis, especially in the detailed view. The best way is to sort by Usefulness coefficient, from the lowest to the highest rate.
Thanks to that, you can see which Automations are least helpful, and you can review the feedback and improve the chatbot’s performance.
Applying feedback - step 1
Choose the time range in the top right corner and sort Automations by Usefulness coefficient, from the lowest to the highest rate.
Start with the automation on the top and click the "Overview" button to see a detailed view.
Applying feedback - step 2
Now you can see one particular Automation. Change the time range to the same value as it was in the previous view.
Applying feedback - step 3
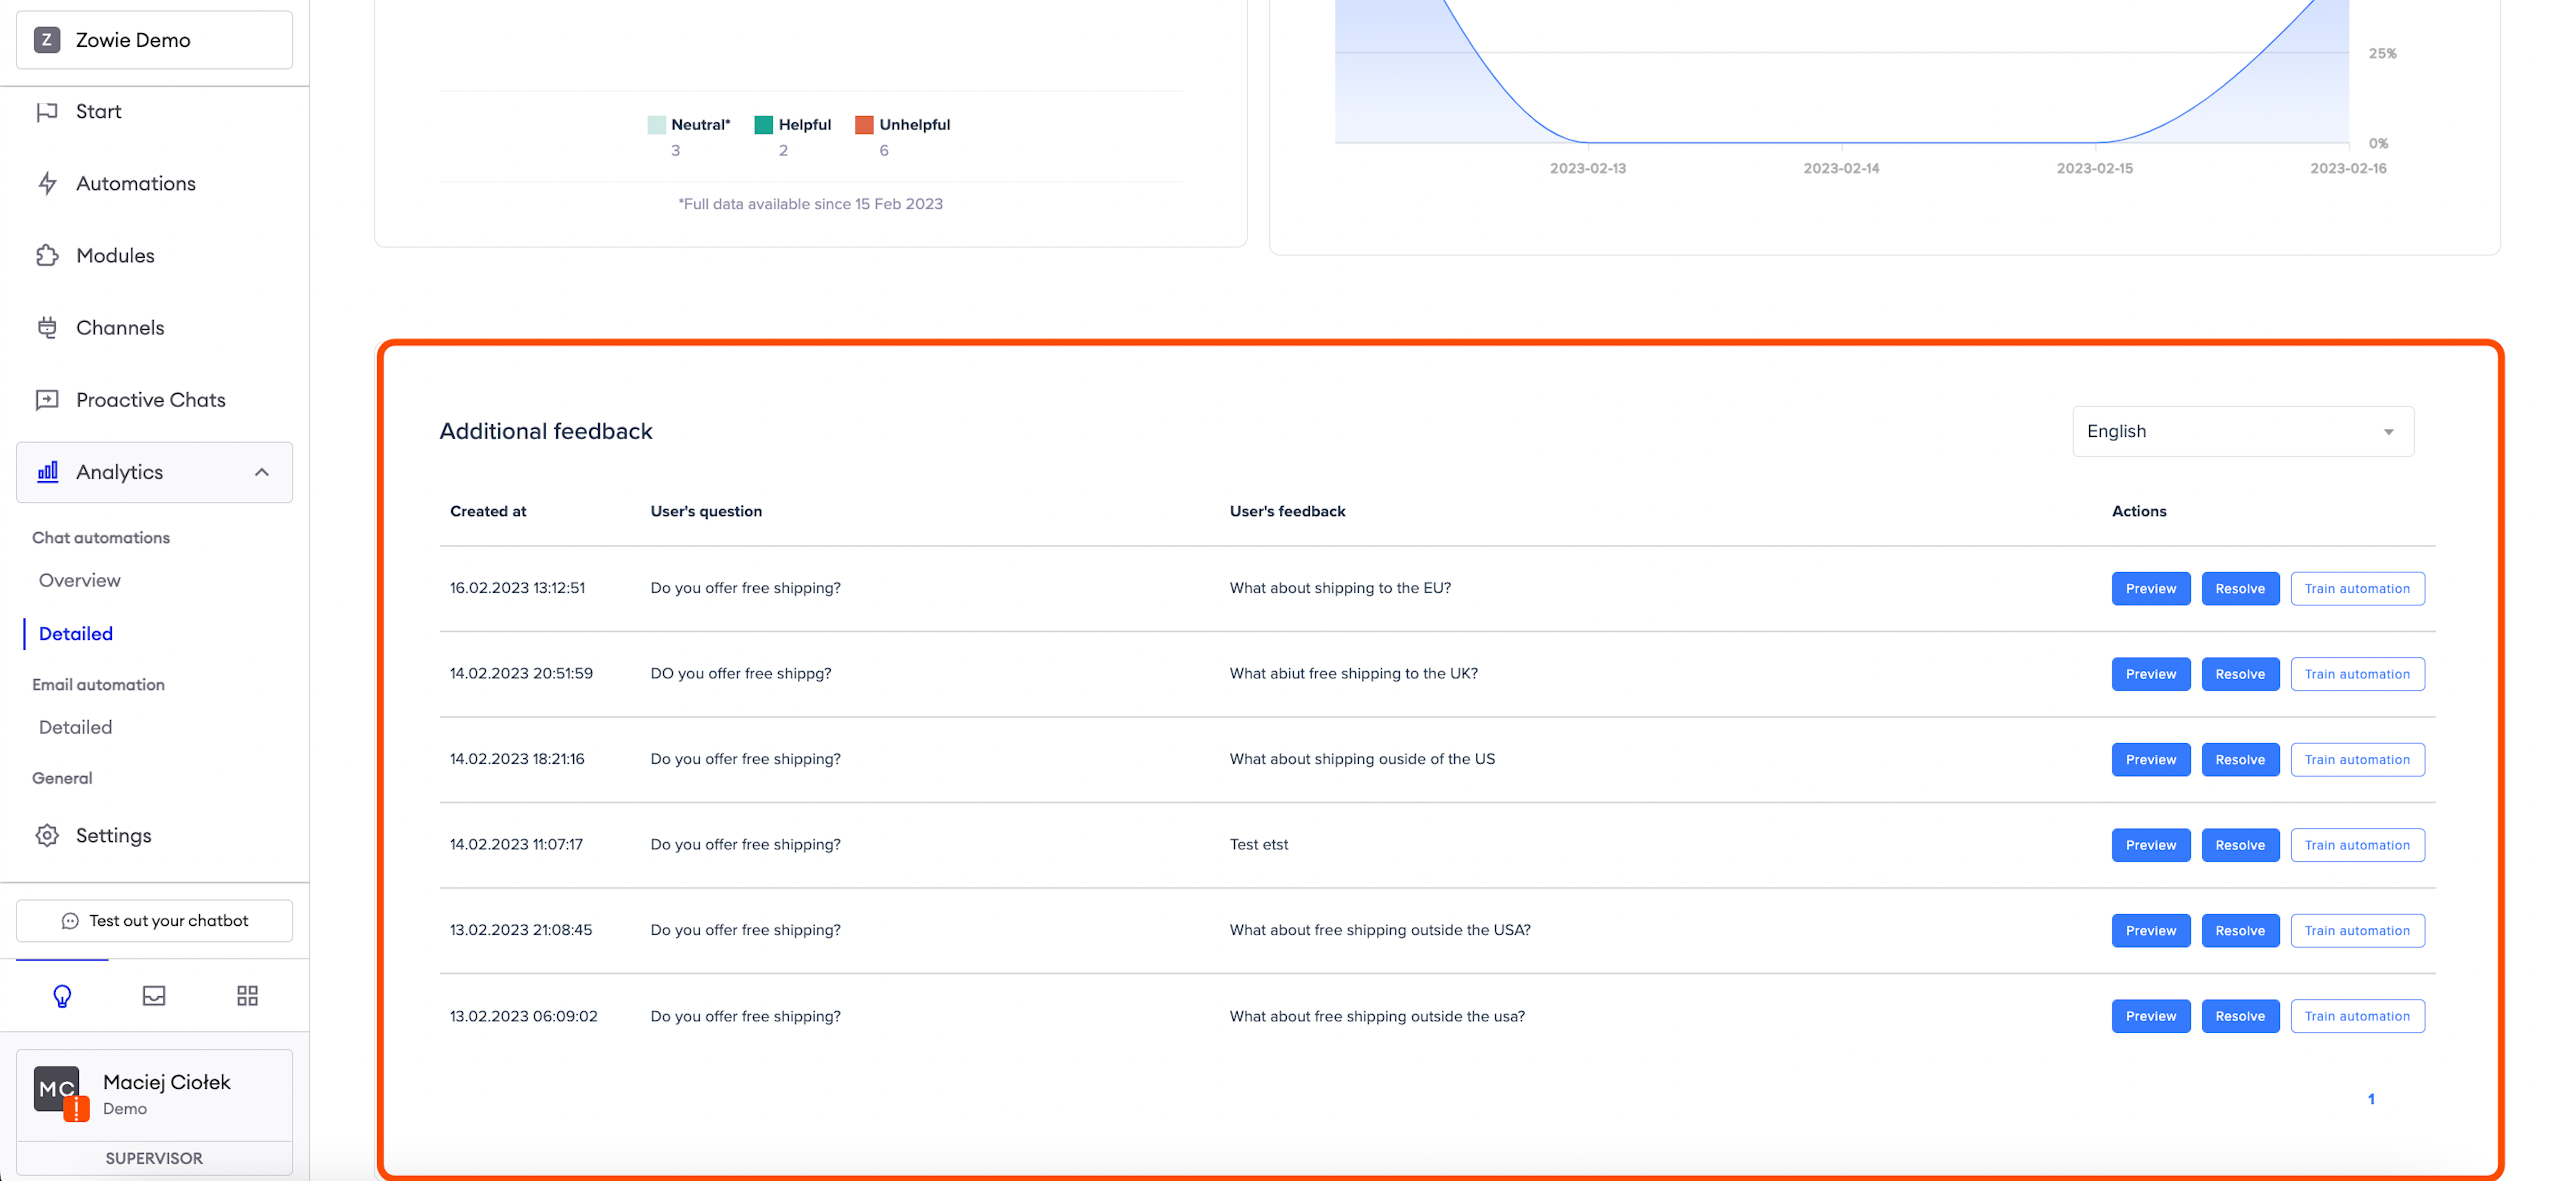
Scroll down to the _Additional feedback _section.
Here you’ll find each customer’s answer. Now you have three buttons:
- Preview: you can check the whole conversation, get to know the context and decide if the feedback is valuable, for example, some information is missing in the Automation;
- Resolve: if the feedback is not valuable or you’ve just updated the answer you can use this button to clean up the list;
- Train automation: user’s question may fit the learning phrases to this particular automation or totally different one - that’s why you have the option to train Automation and choose to which one the question should be added.
In the case presented on the left, you should check the conversation preview, probably add short information in the answer if the return can be made in 30 business or calendar days, and resolve the Automation.