Overall Performance - Home Dashboard
What is Home Dashboard?
In Home Dashboard you can verify your chatbot’s performance without diving into advanced analytics.
Why use Home Dashboard?
Home Dashboard allows you to clearly see the value our chatbot is bringing your company. You’ll identify where you can increase your automation rate and make your customer service improve.
How to access Home Dashboard
To access Home Dashboard, go to the Home section from the navigation bar.
Available data
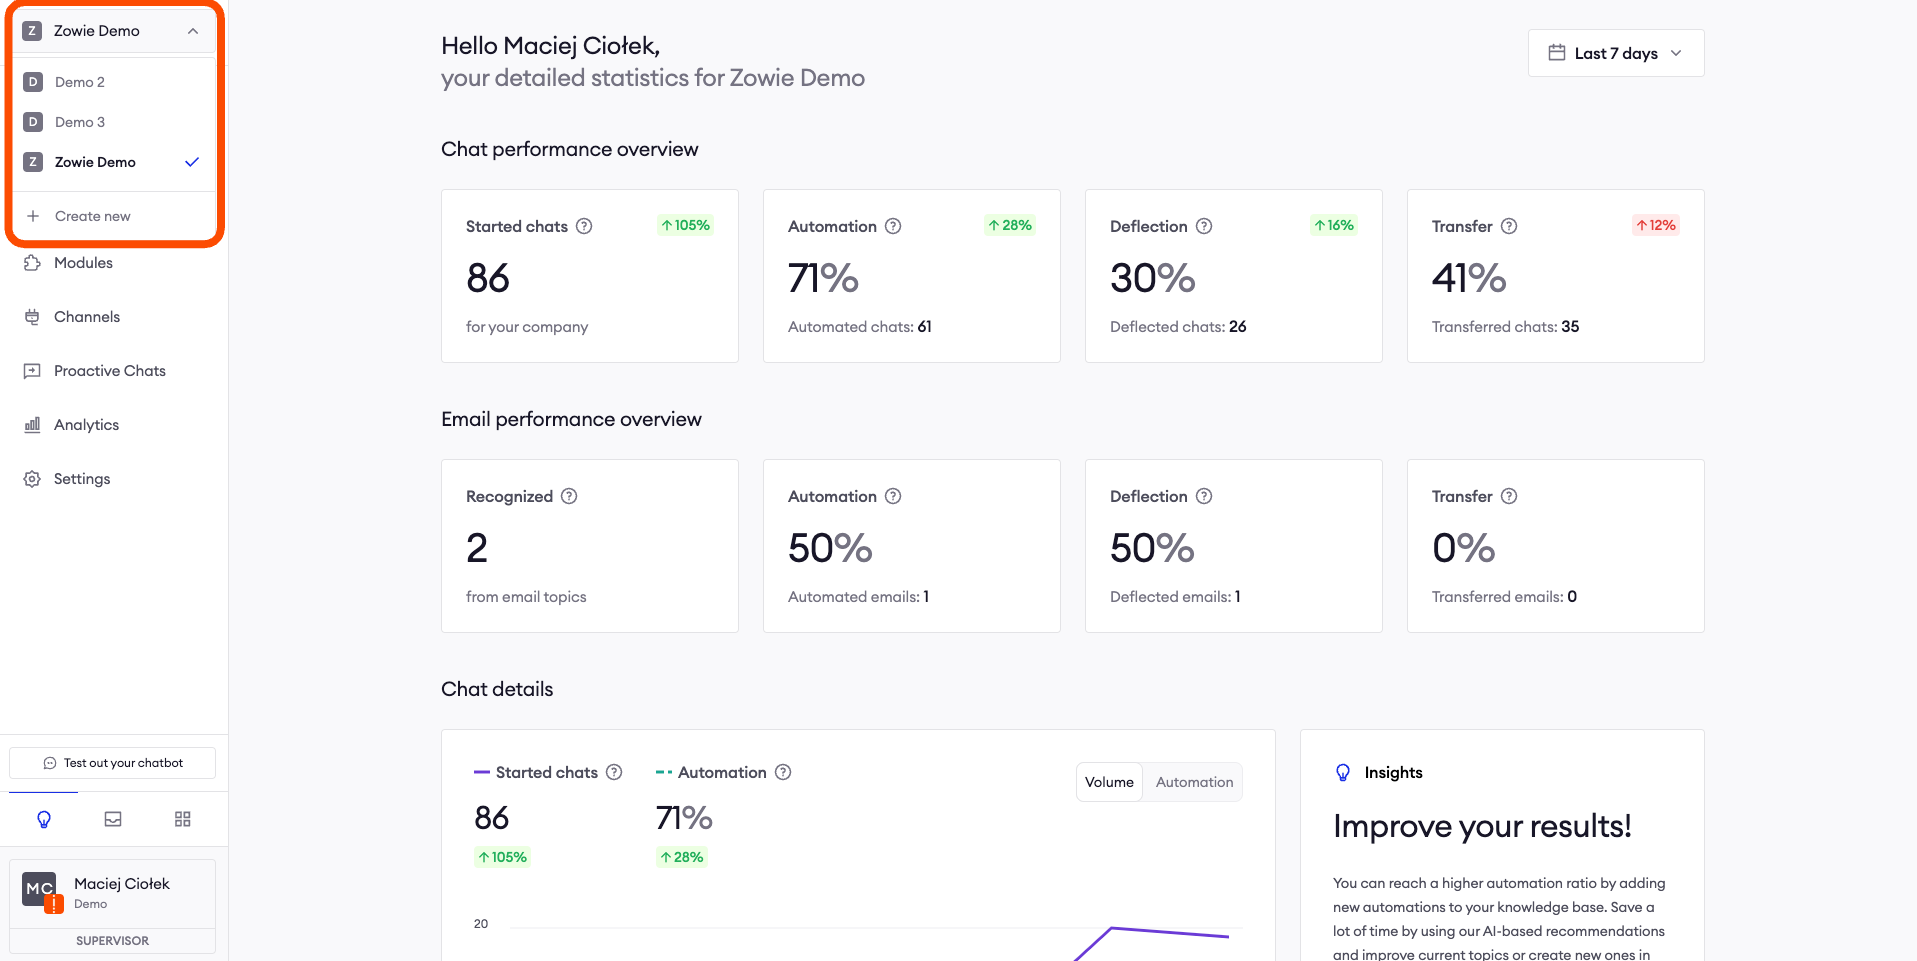
The Home Dashboard displays data from the currently selected chatbot. If you have more than one chatbot added to your workspace, you can switch between them in the navigation menu.
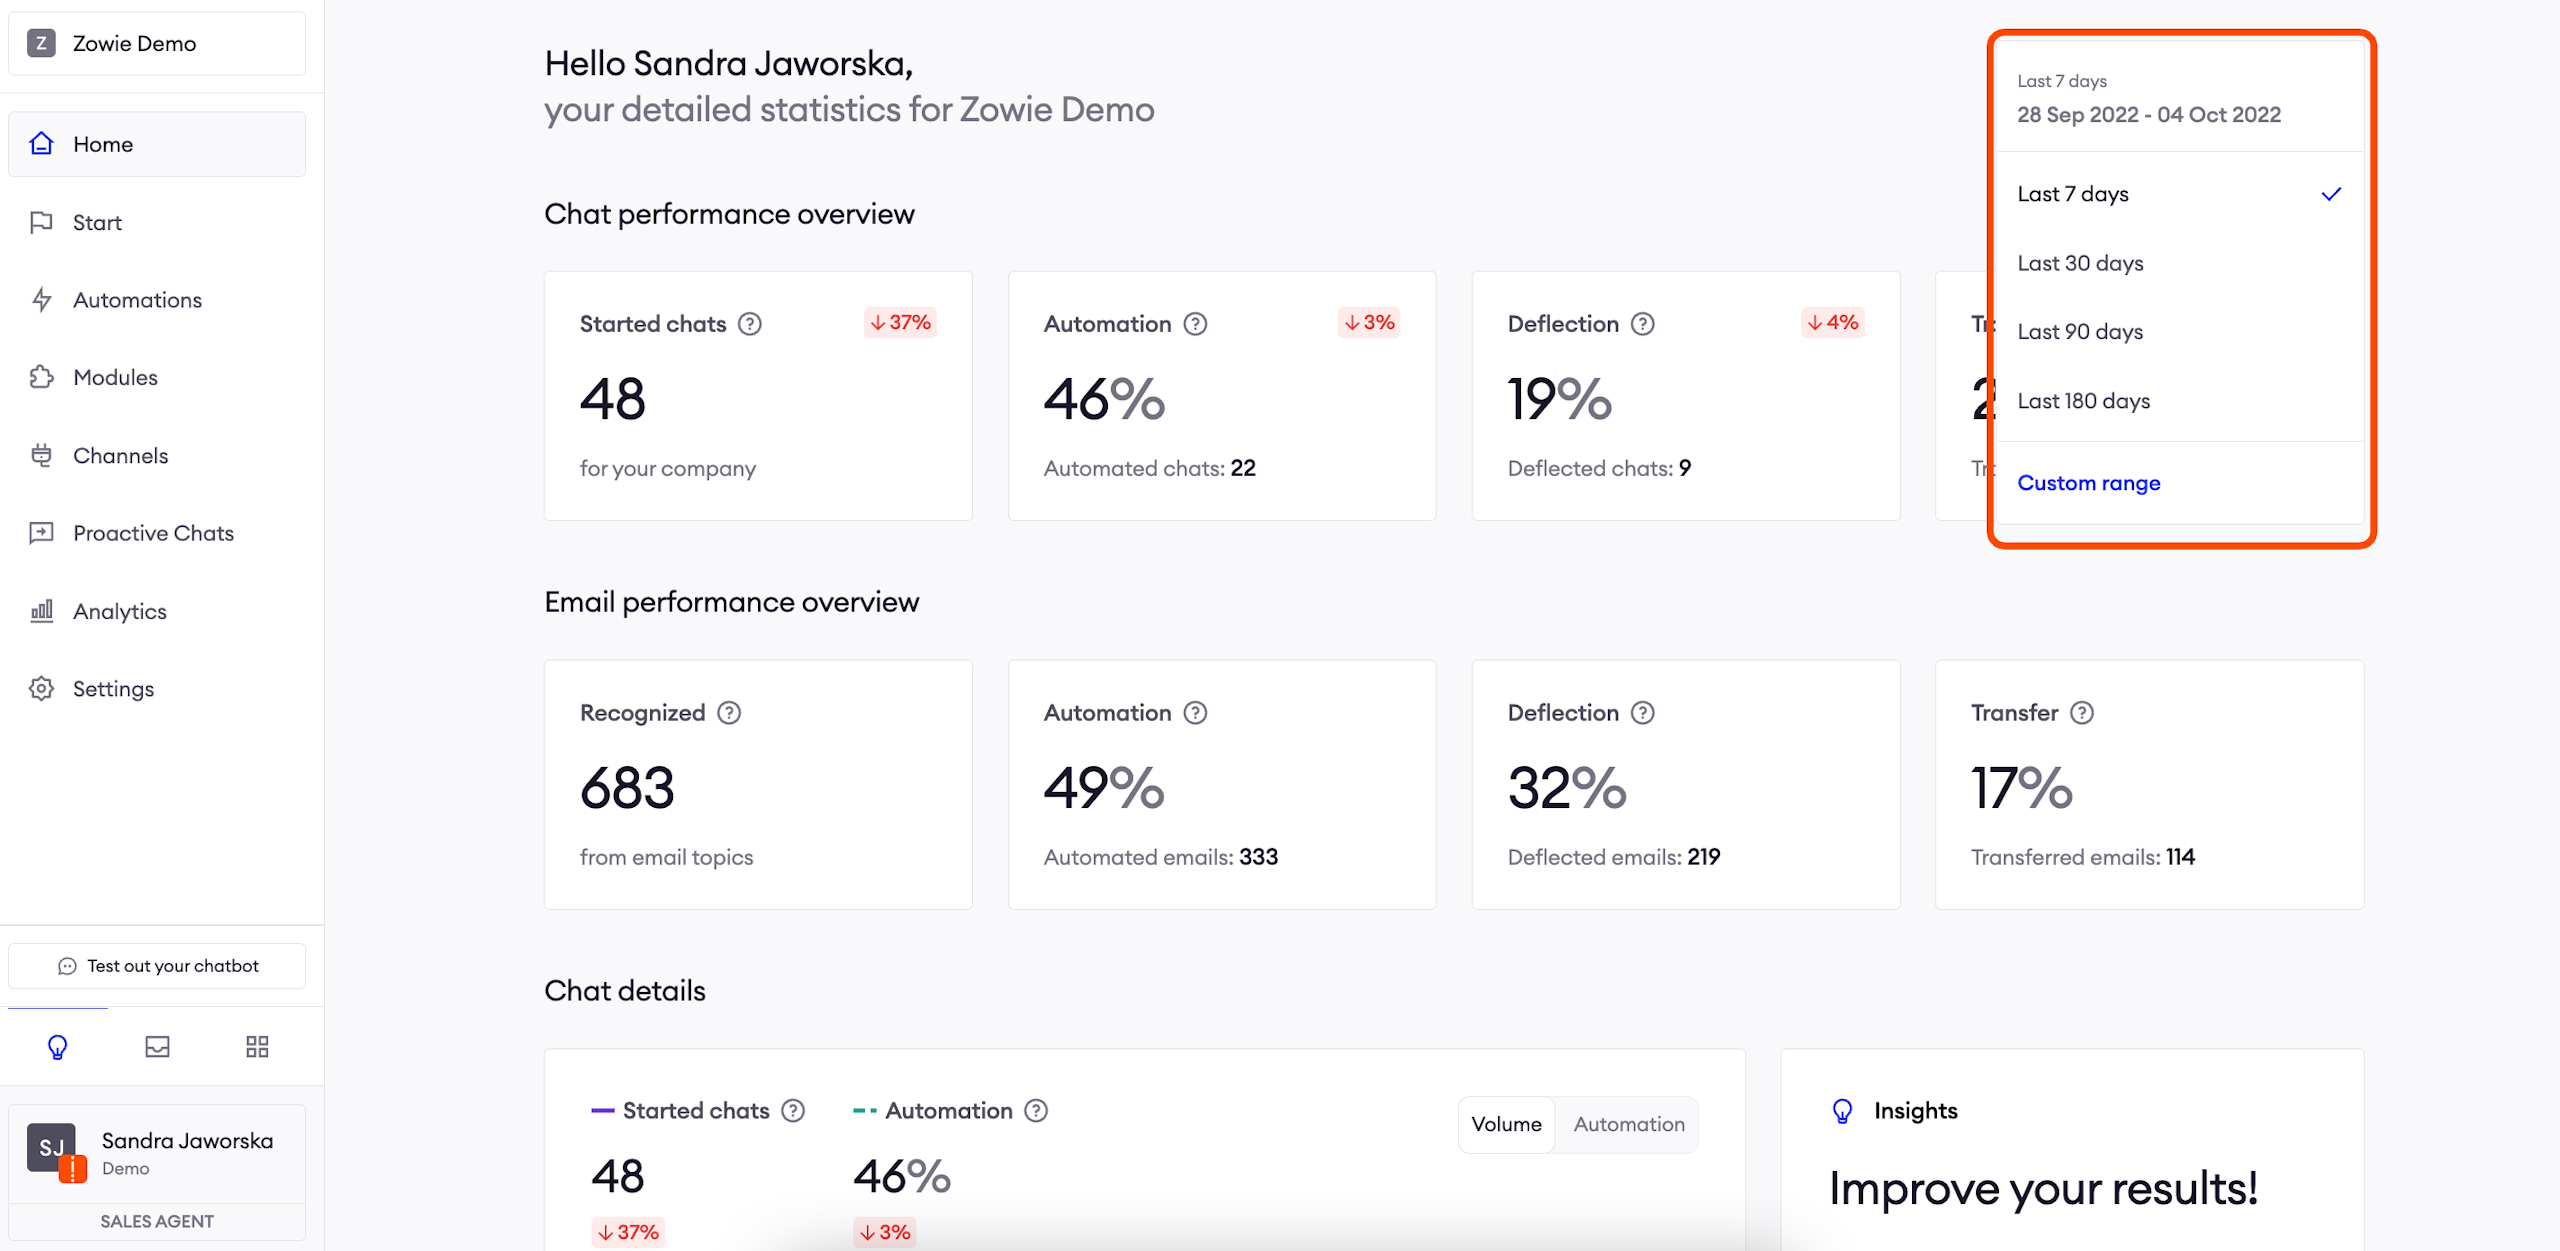
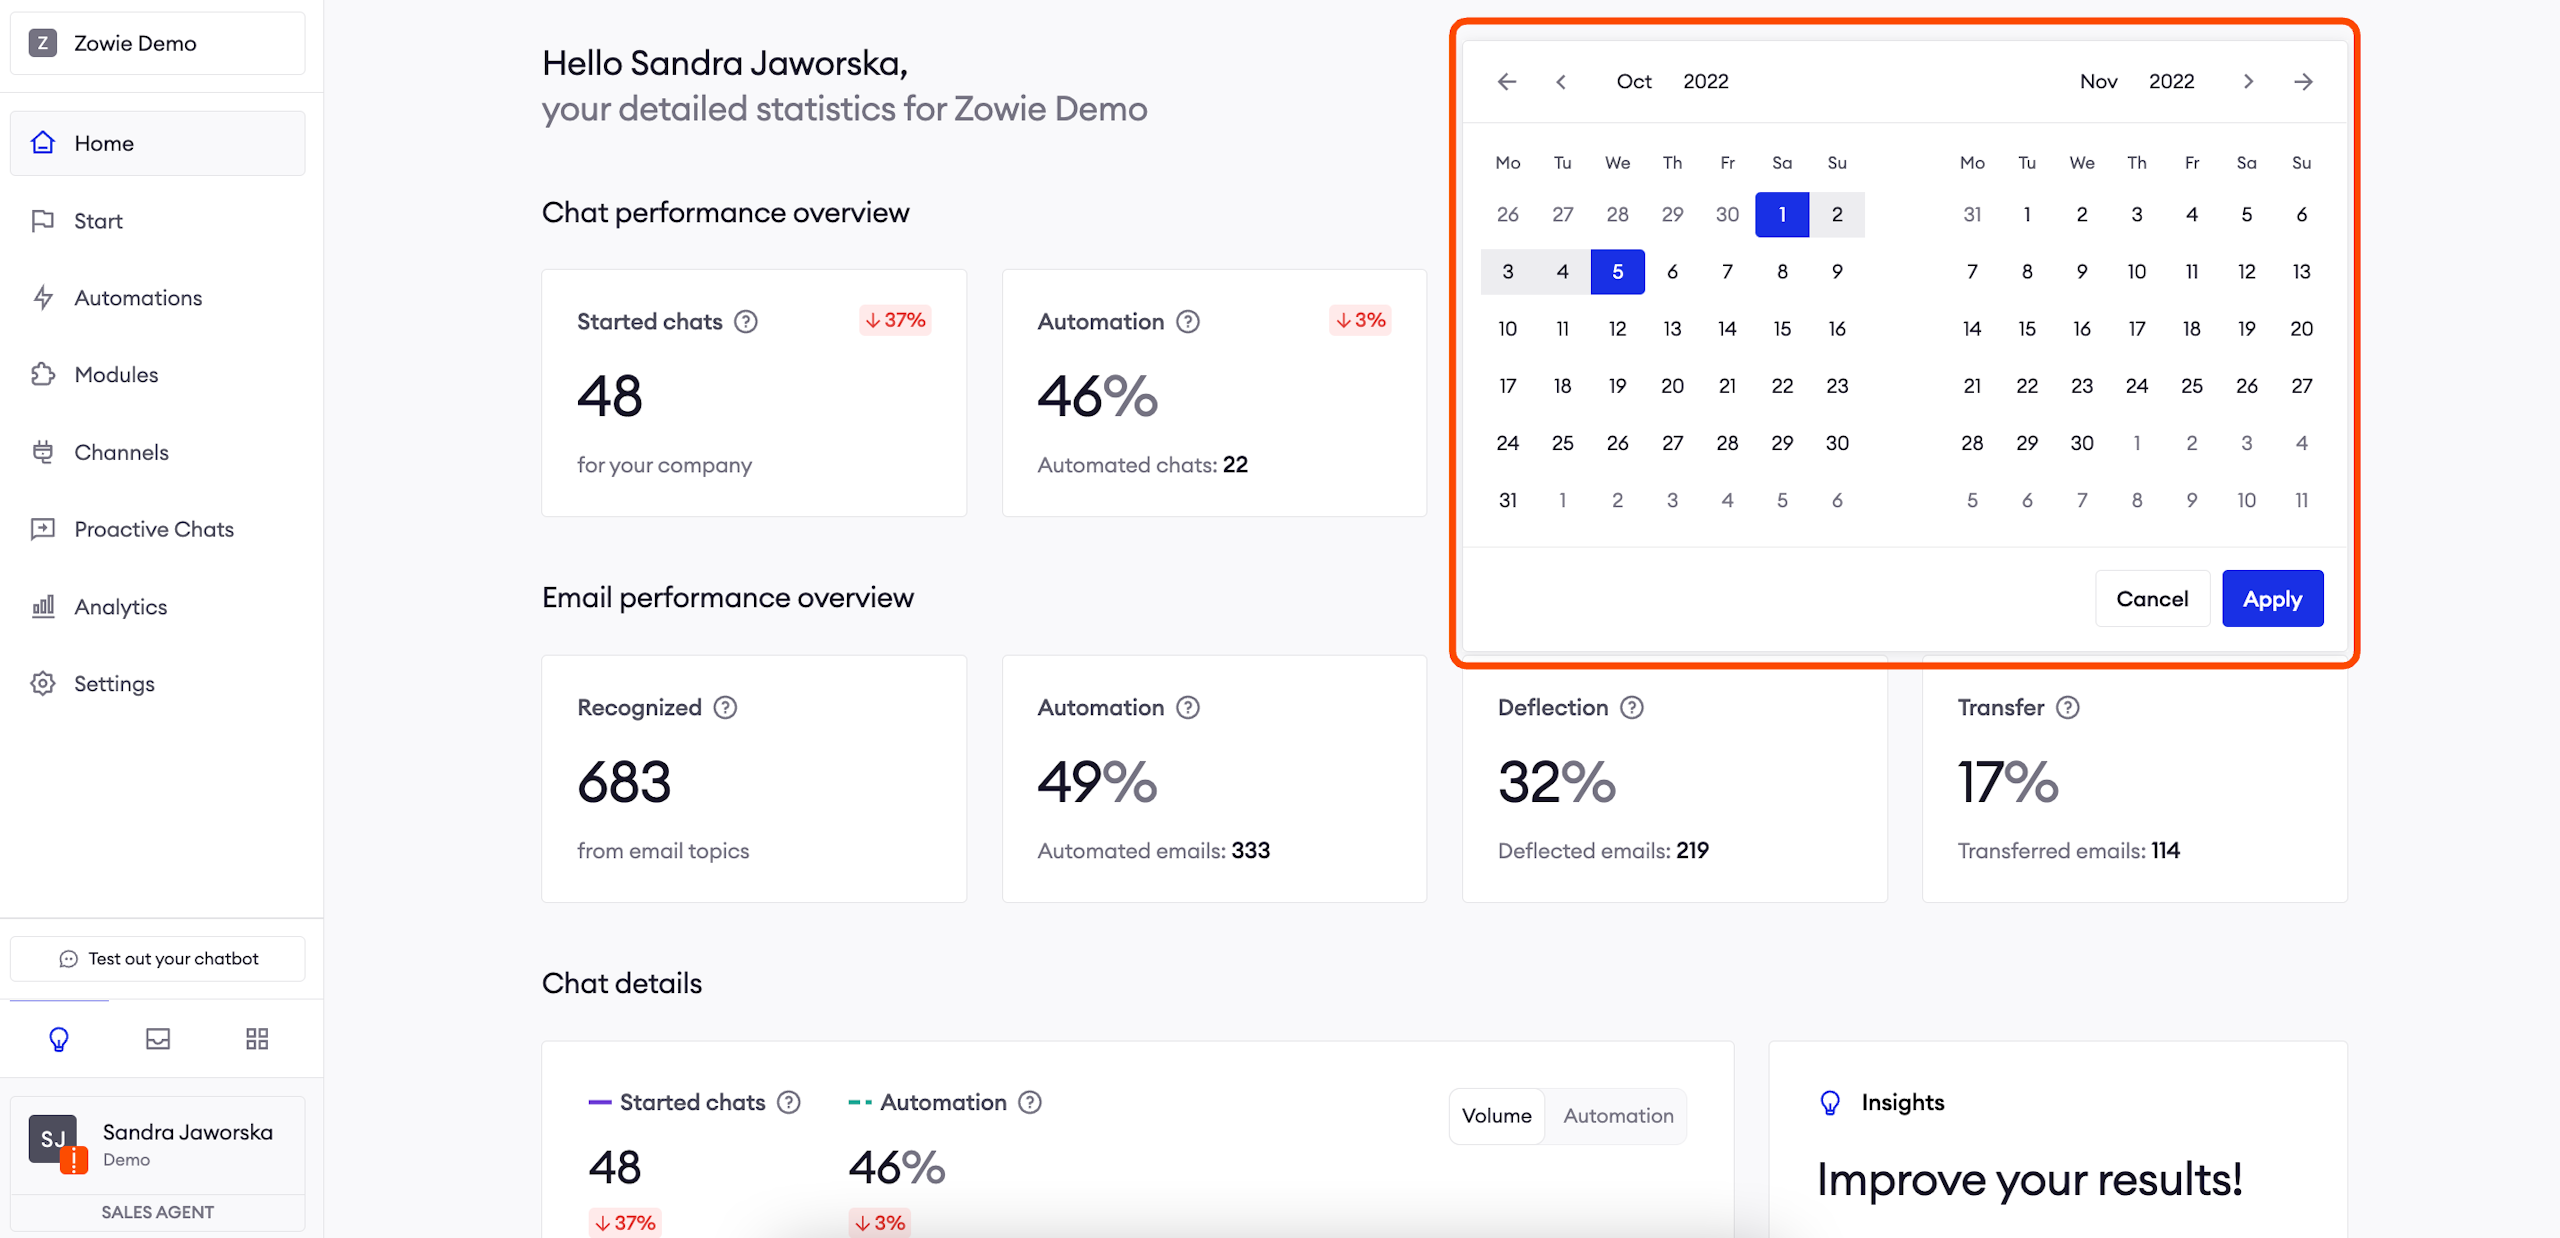
You can also select a time frame using the button in the top right corner. It affects all sections displayed on the screen. We prepared four popular time brackets (the last 7, 30, 90, and 180 days), and you can also select a custom range.
Most metrics show you how much they’ve increased or decreased. These values reflect the change between the selected period and the preceding period of equal length.
AttentionOn May 15, I open my Ongoing Dashboard and select Last 7 days to display data from May 8 to May 14 inclusively. These figures are compared against the previous 7-day period of May 1 to May 7.
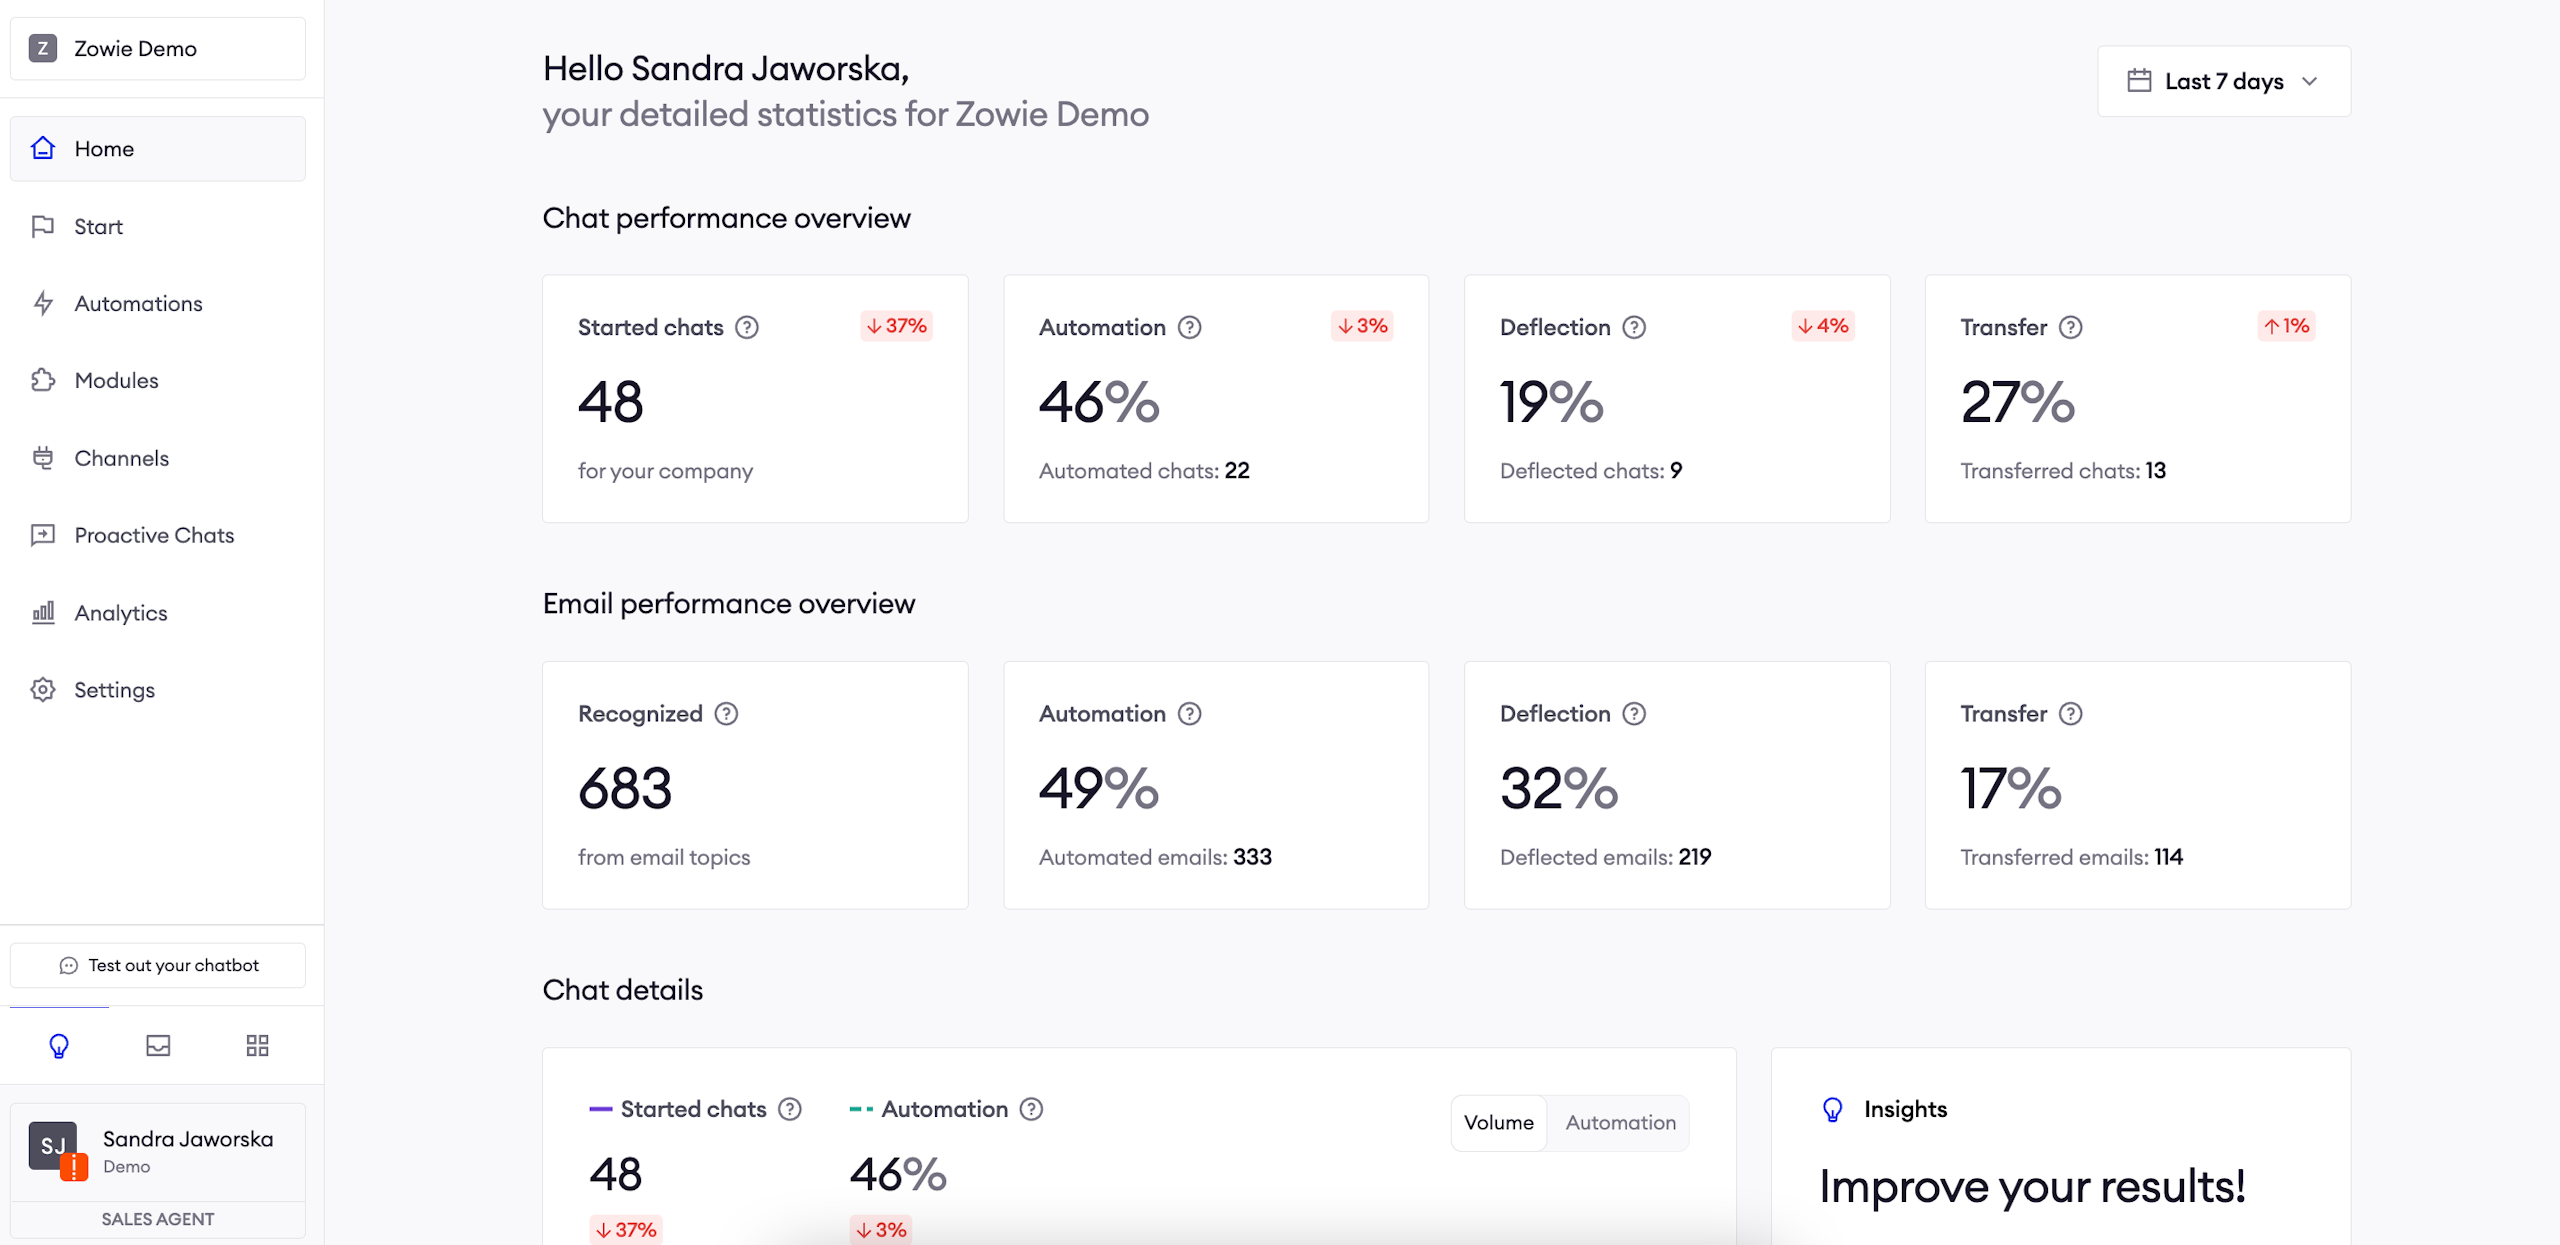
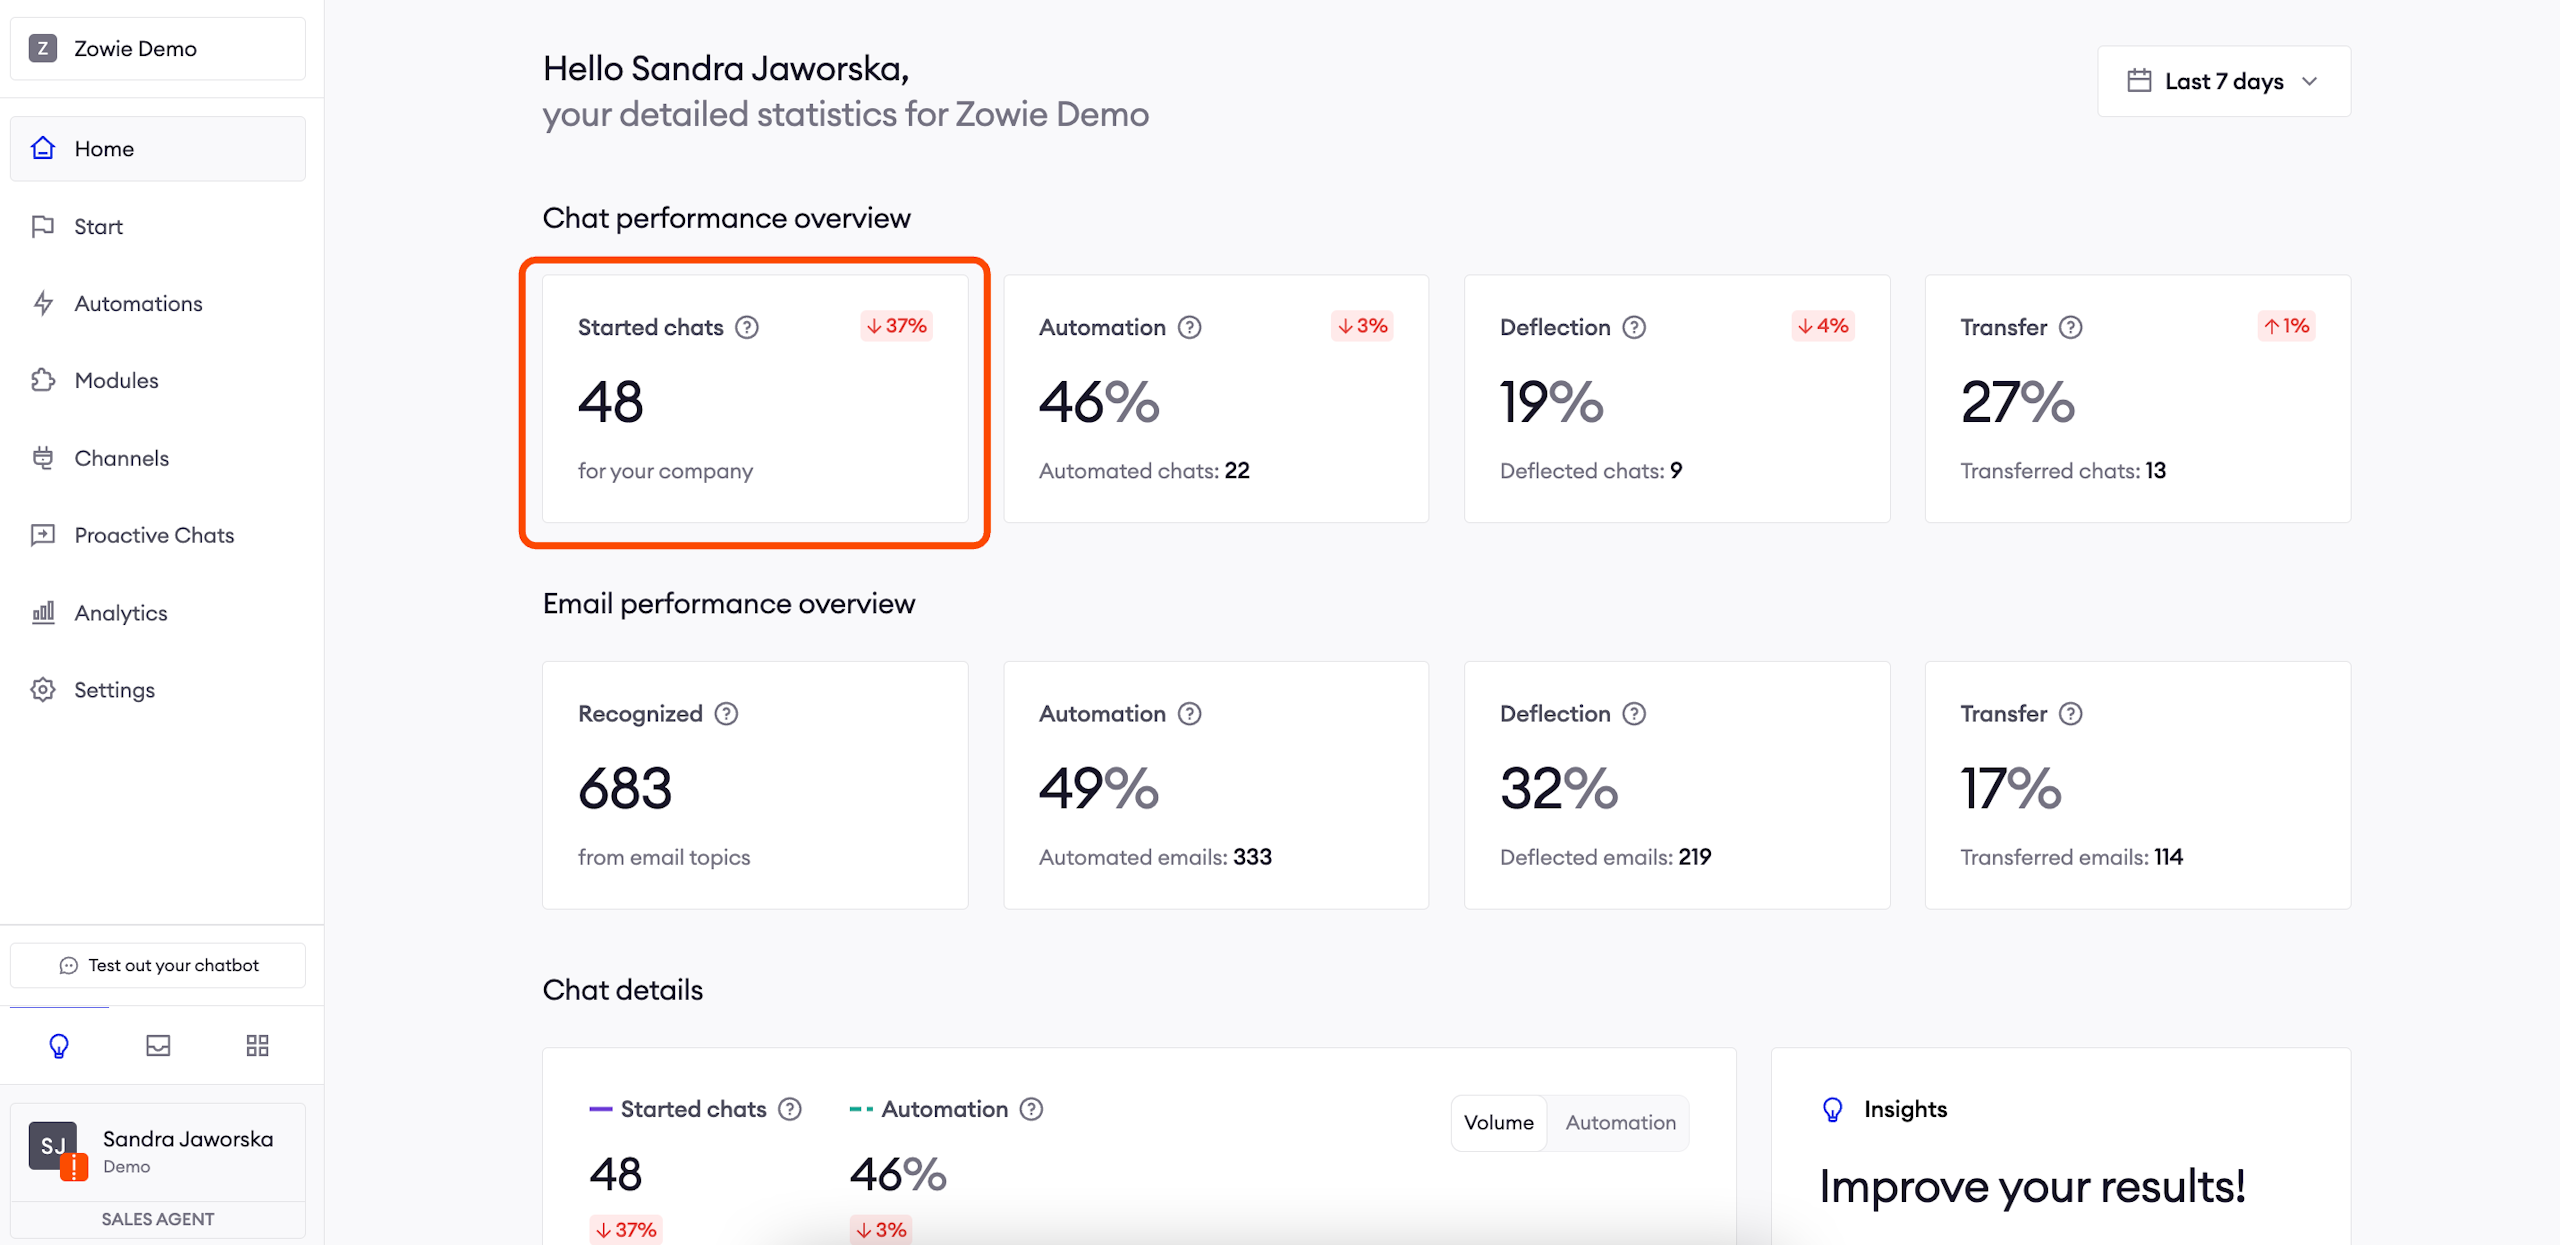
Started chats
This is the total number of unique conversations with the chatbot and agents in the selected time frame. It shows how often your users need assistance and how this value changed compared to the previous period. You can use it to identify specific events in your business environment that increase or decrease traffic.
A conversation is counted as new if either one of the following is true:
- It’s the first message the user sent to the chatbot and initialized the conversation.
- It’s the user’s first message in the conversation after 1 hr of inactivity (without sending messages to the chatbot).
This way, conversations where users are slow to respond (less than 1 hr per reply) won’t count towards this metric. It will reflect real traffic.
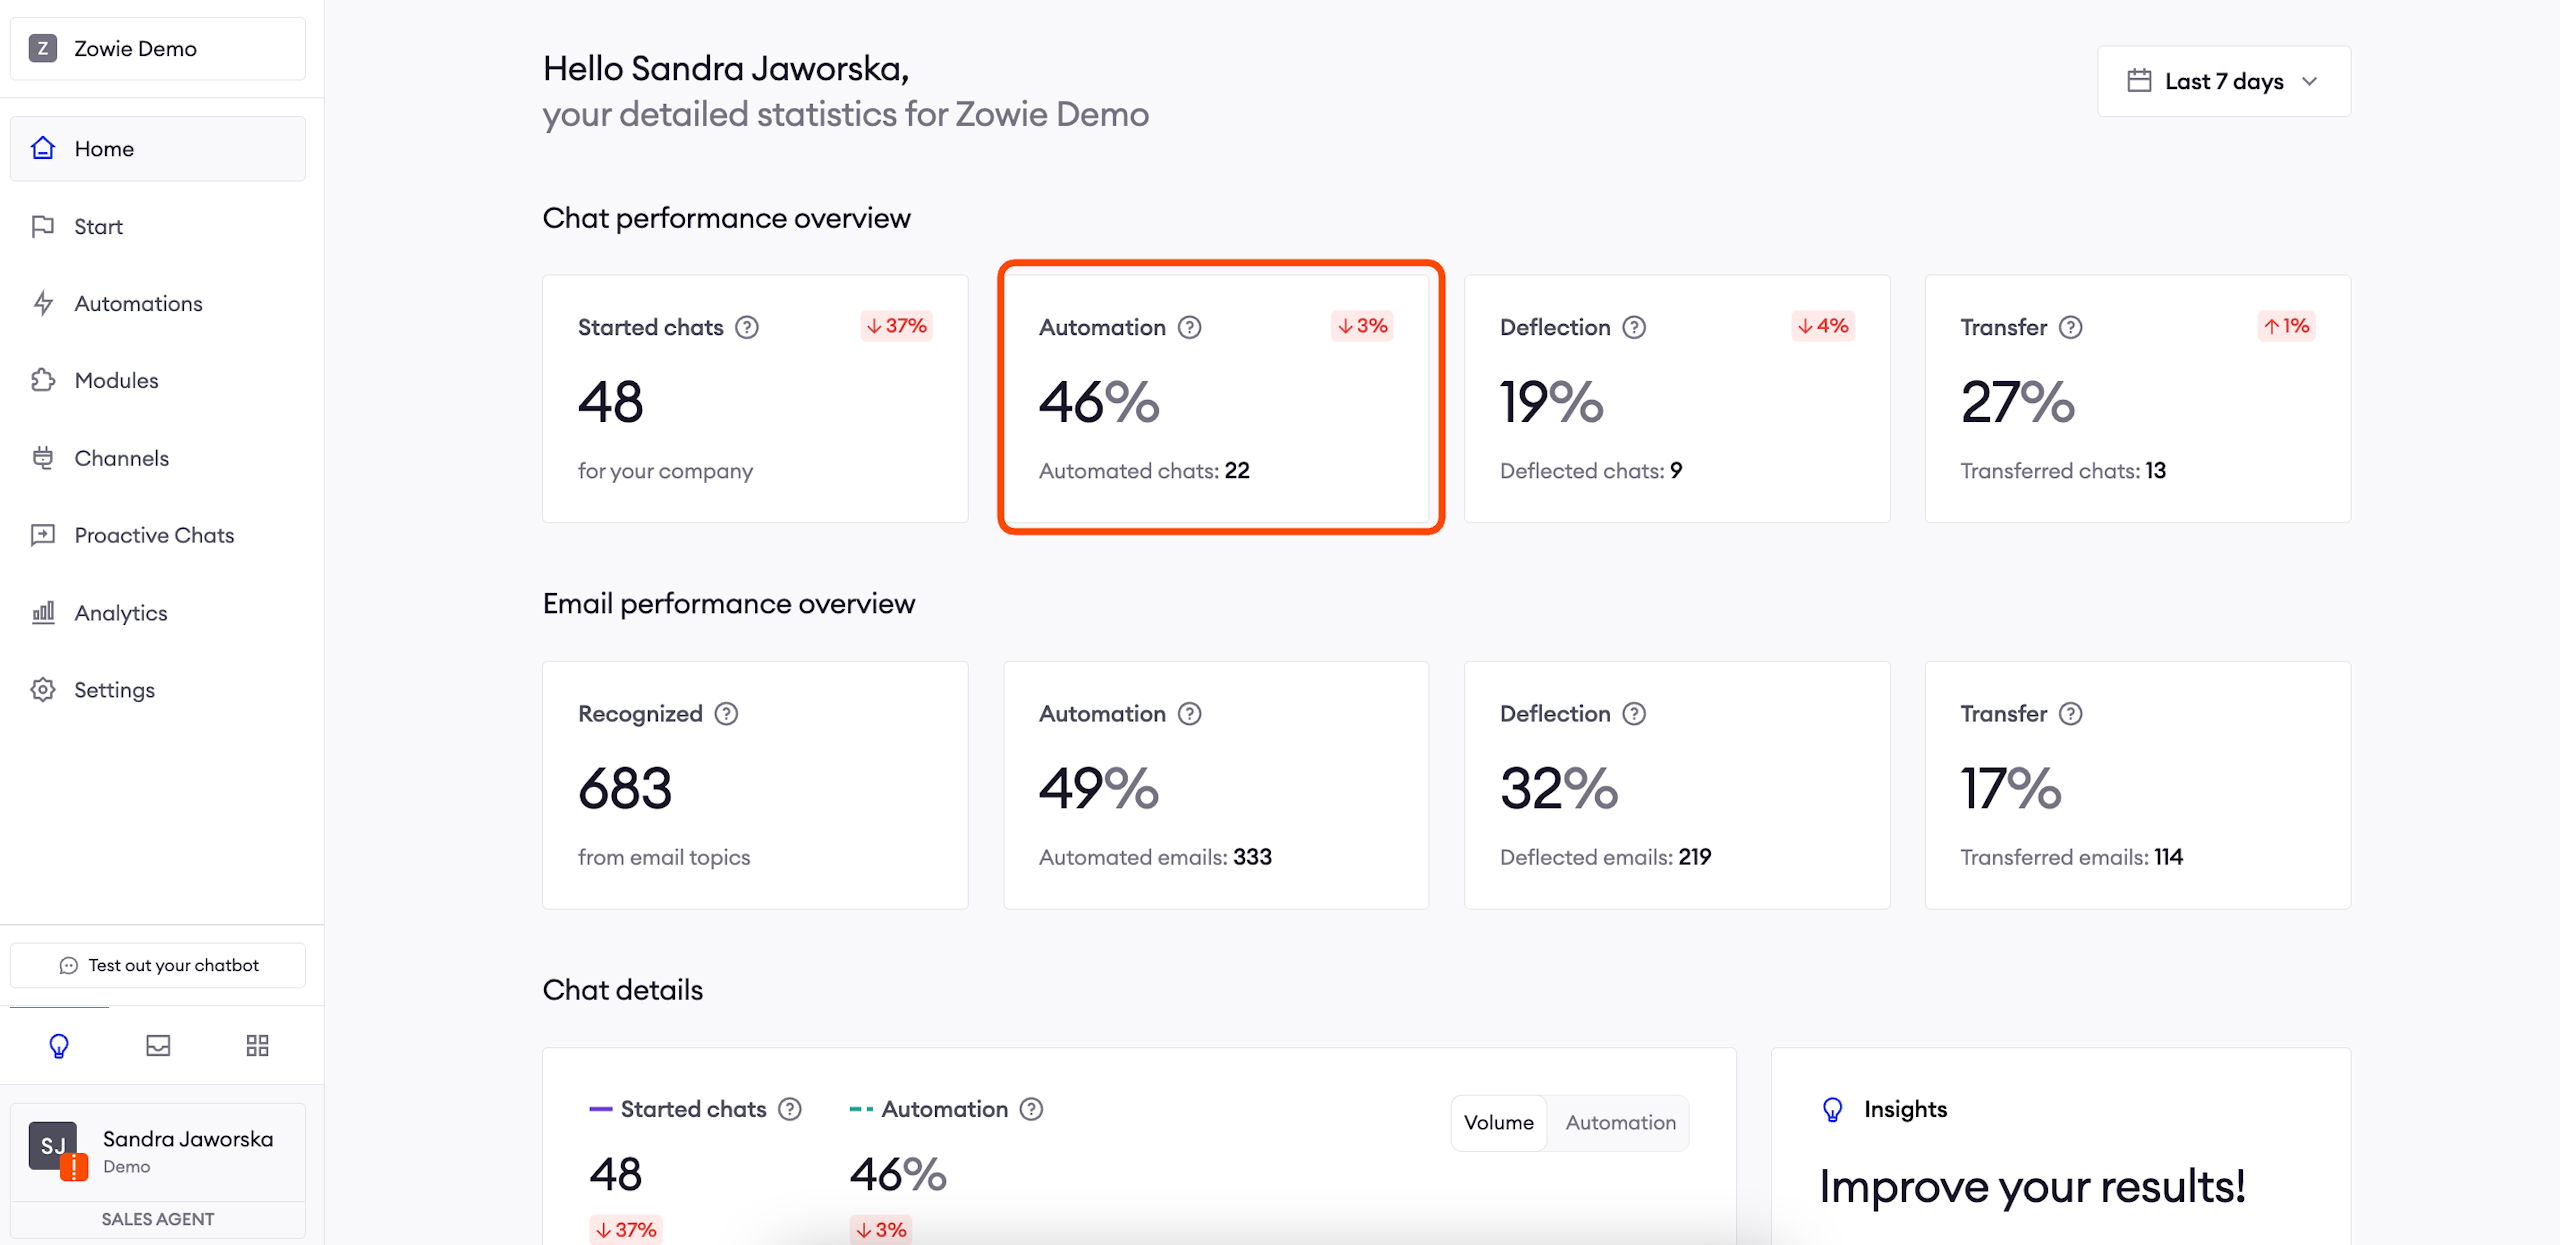
Automation
This displays the percentage of Traffic that Zowie automates. Based on this metric, you can determine how much you’re automating and your remaining automation needs.
A chat is automated when one of the following is true:
-
The chatbot recognized any of the user's intents and acted according to the configuration.
-
The user didn't write a message but initiated an action that triggered a configured response (e.g., clicking a button).
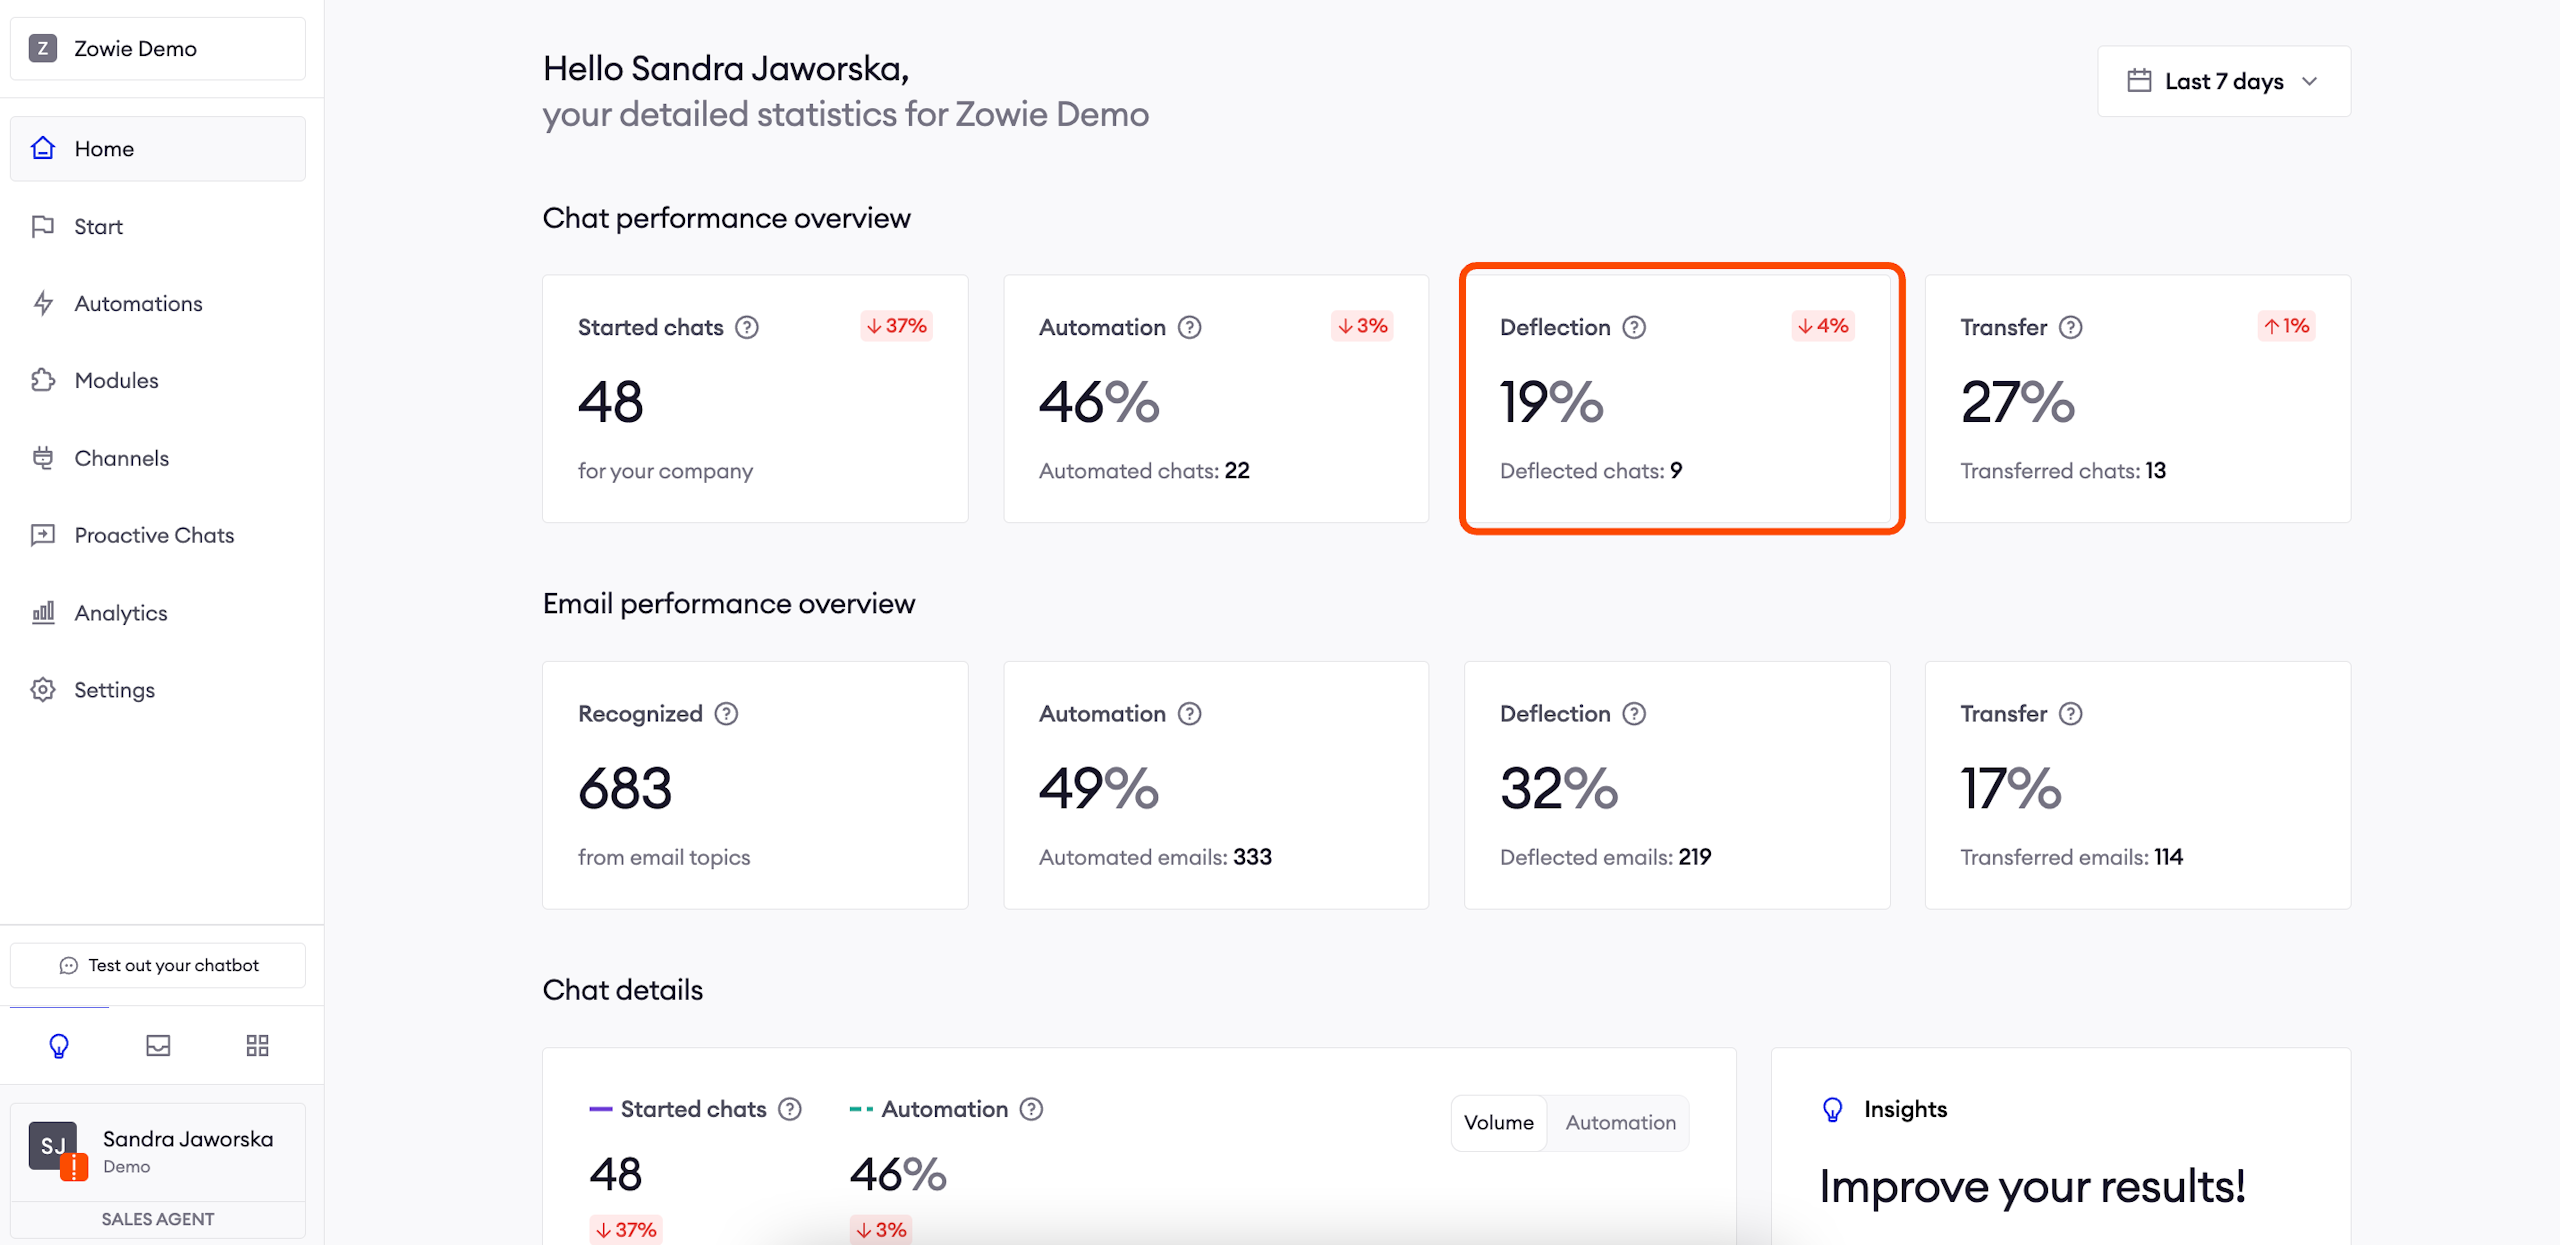
Deflection
Deflected chats are Automated chats that were handled without a human agent because the chatbot served its purpose. As you enable more accurate Automations, this metrics will increase.
We count this as the percentage of all Traffic where the conversation was both automated and not transferred to an agent. This way, you’ll only see conversations where the chatbot truly replaced an agent.
Transfer
Transferred chats are Automated chats that were handed over to your Agents intentionally. In these conversations, the chatbot correctly recognized the user’s intent and forwarded the chat according to configured Handovers and Surveys
We count this as the percentage of all Traffic where the conversation was automated and transferred to an agent.
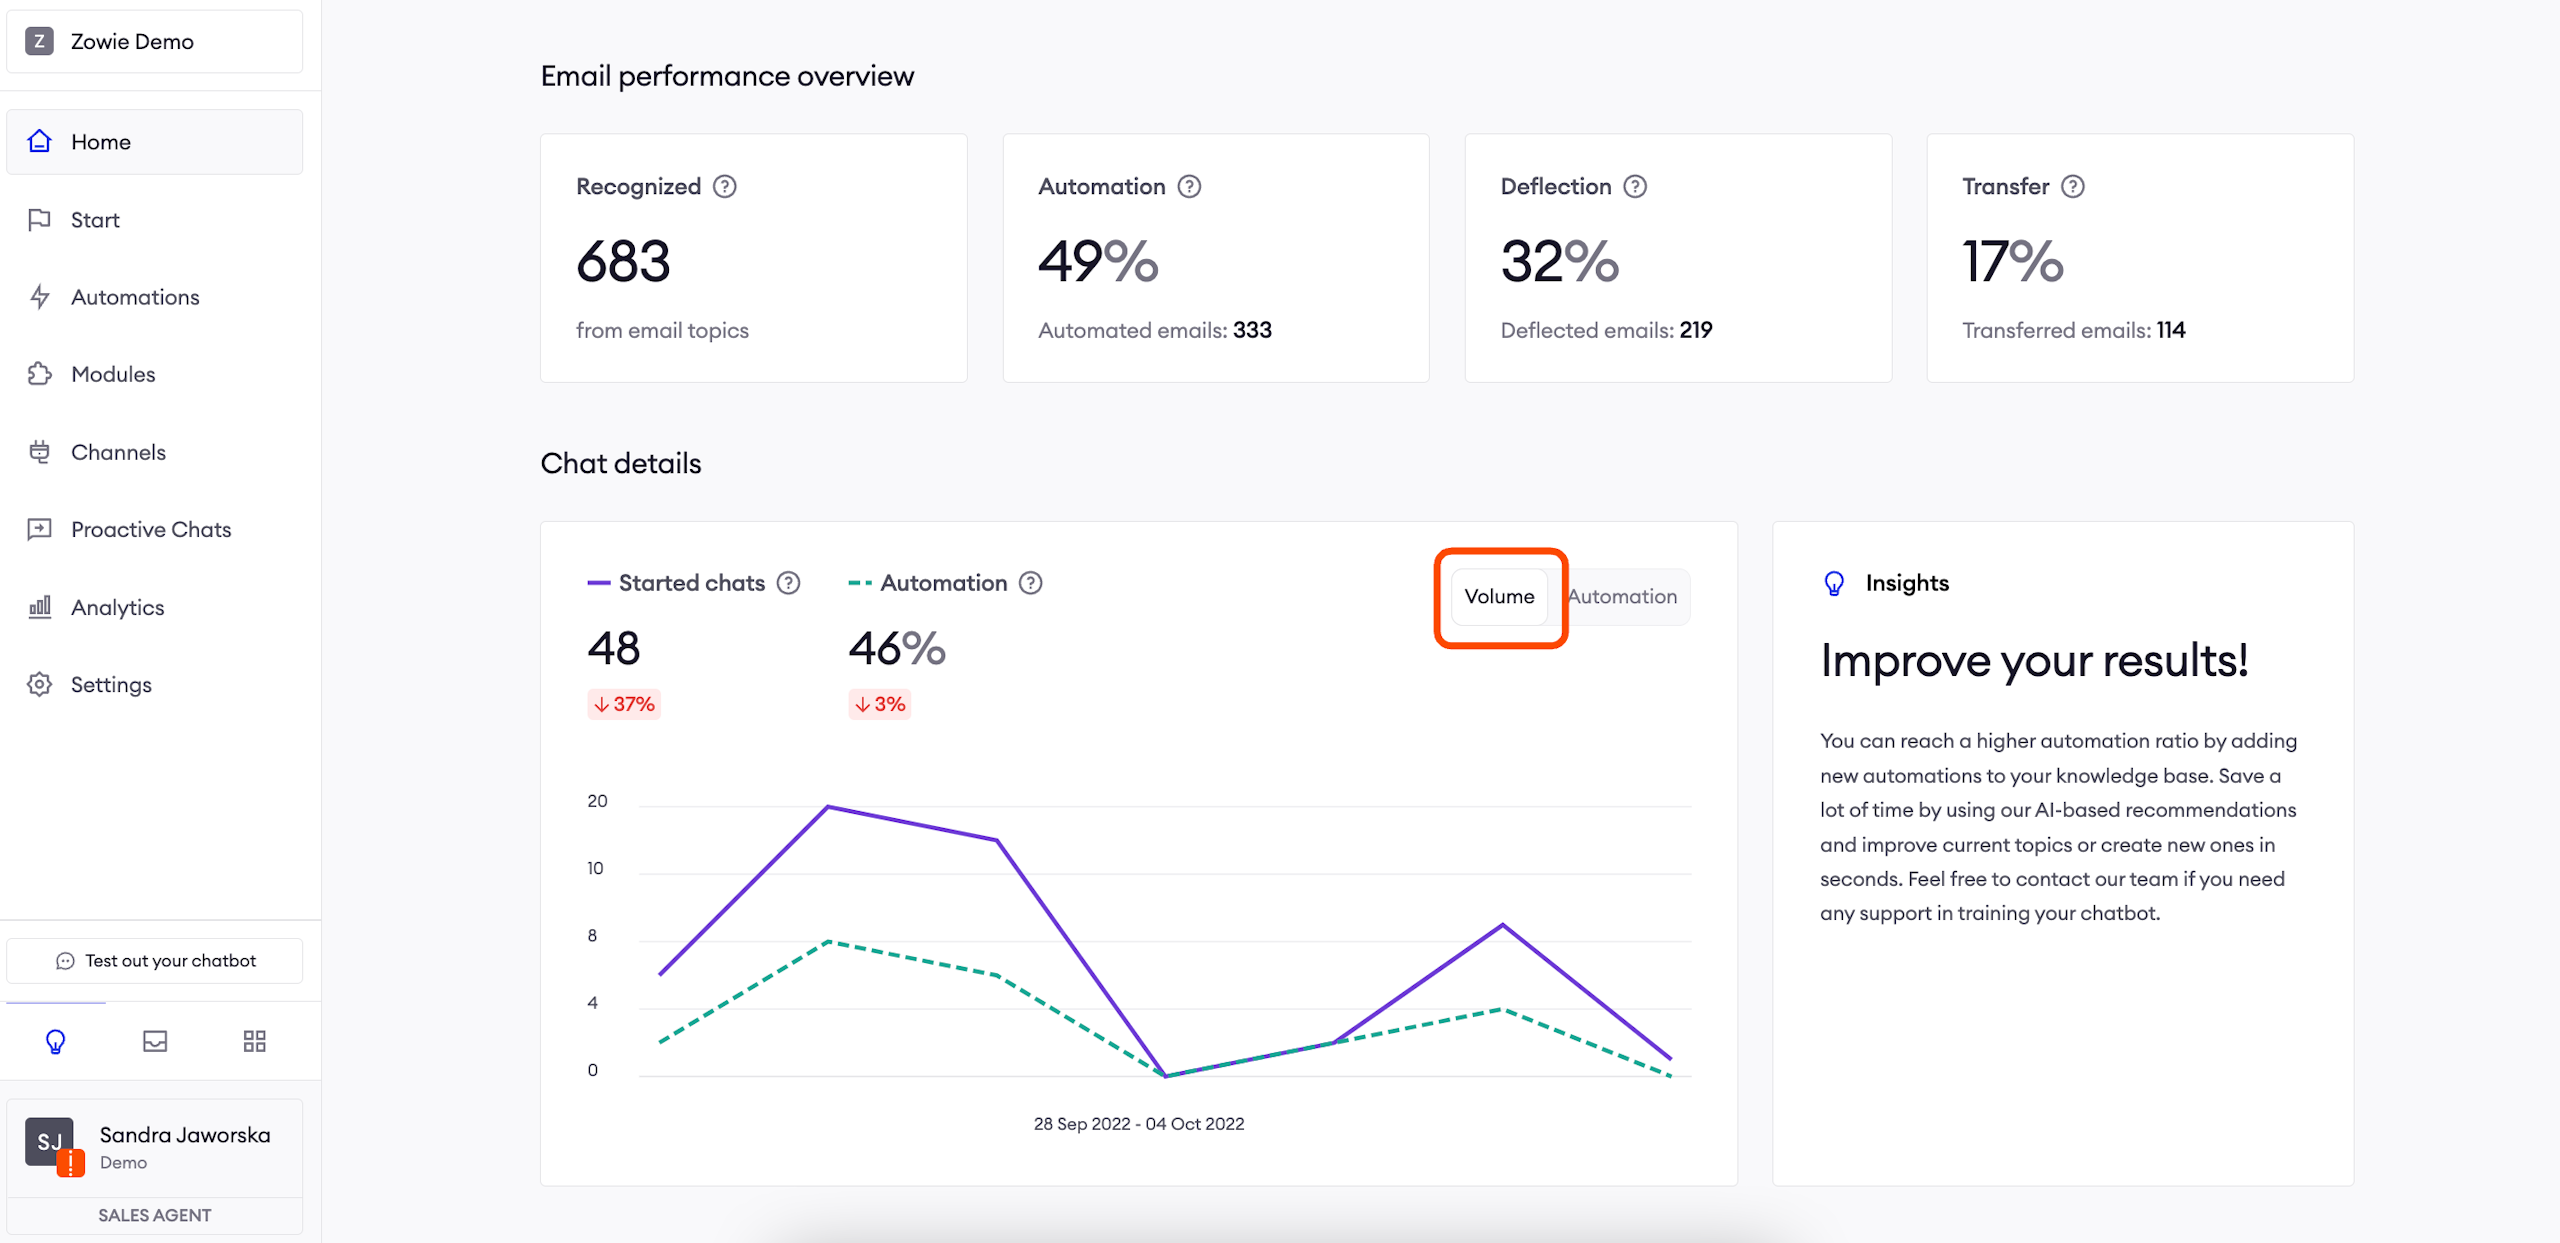
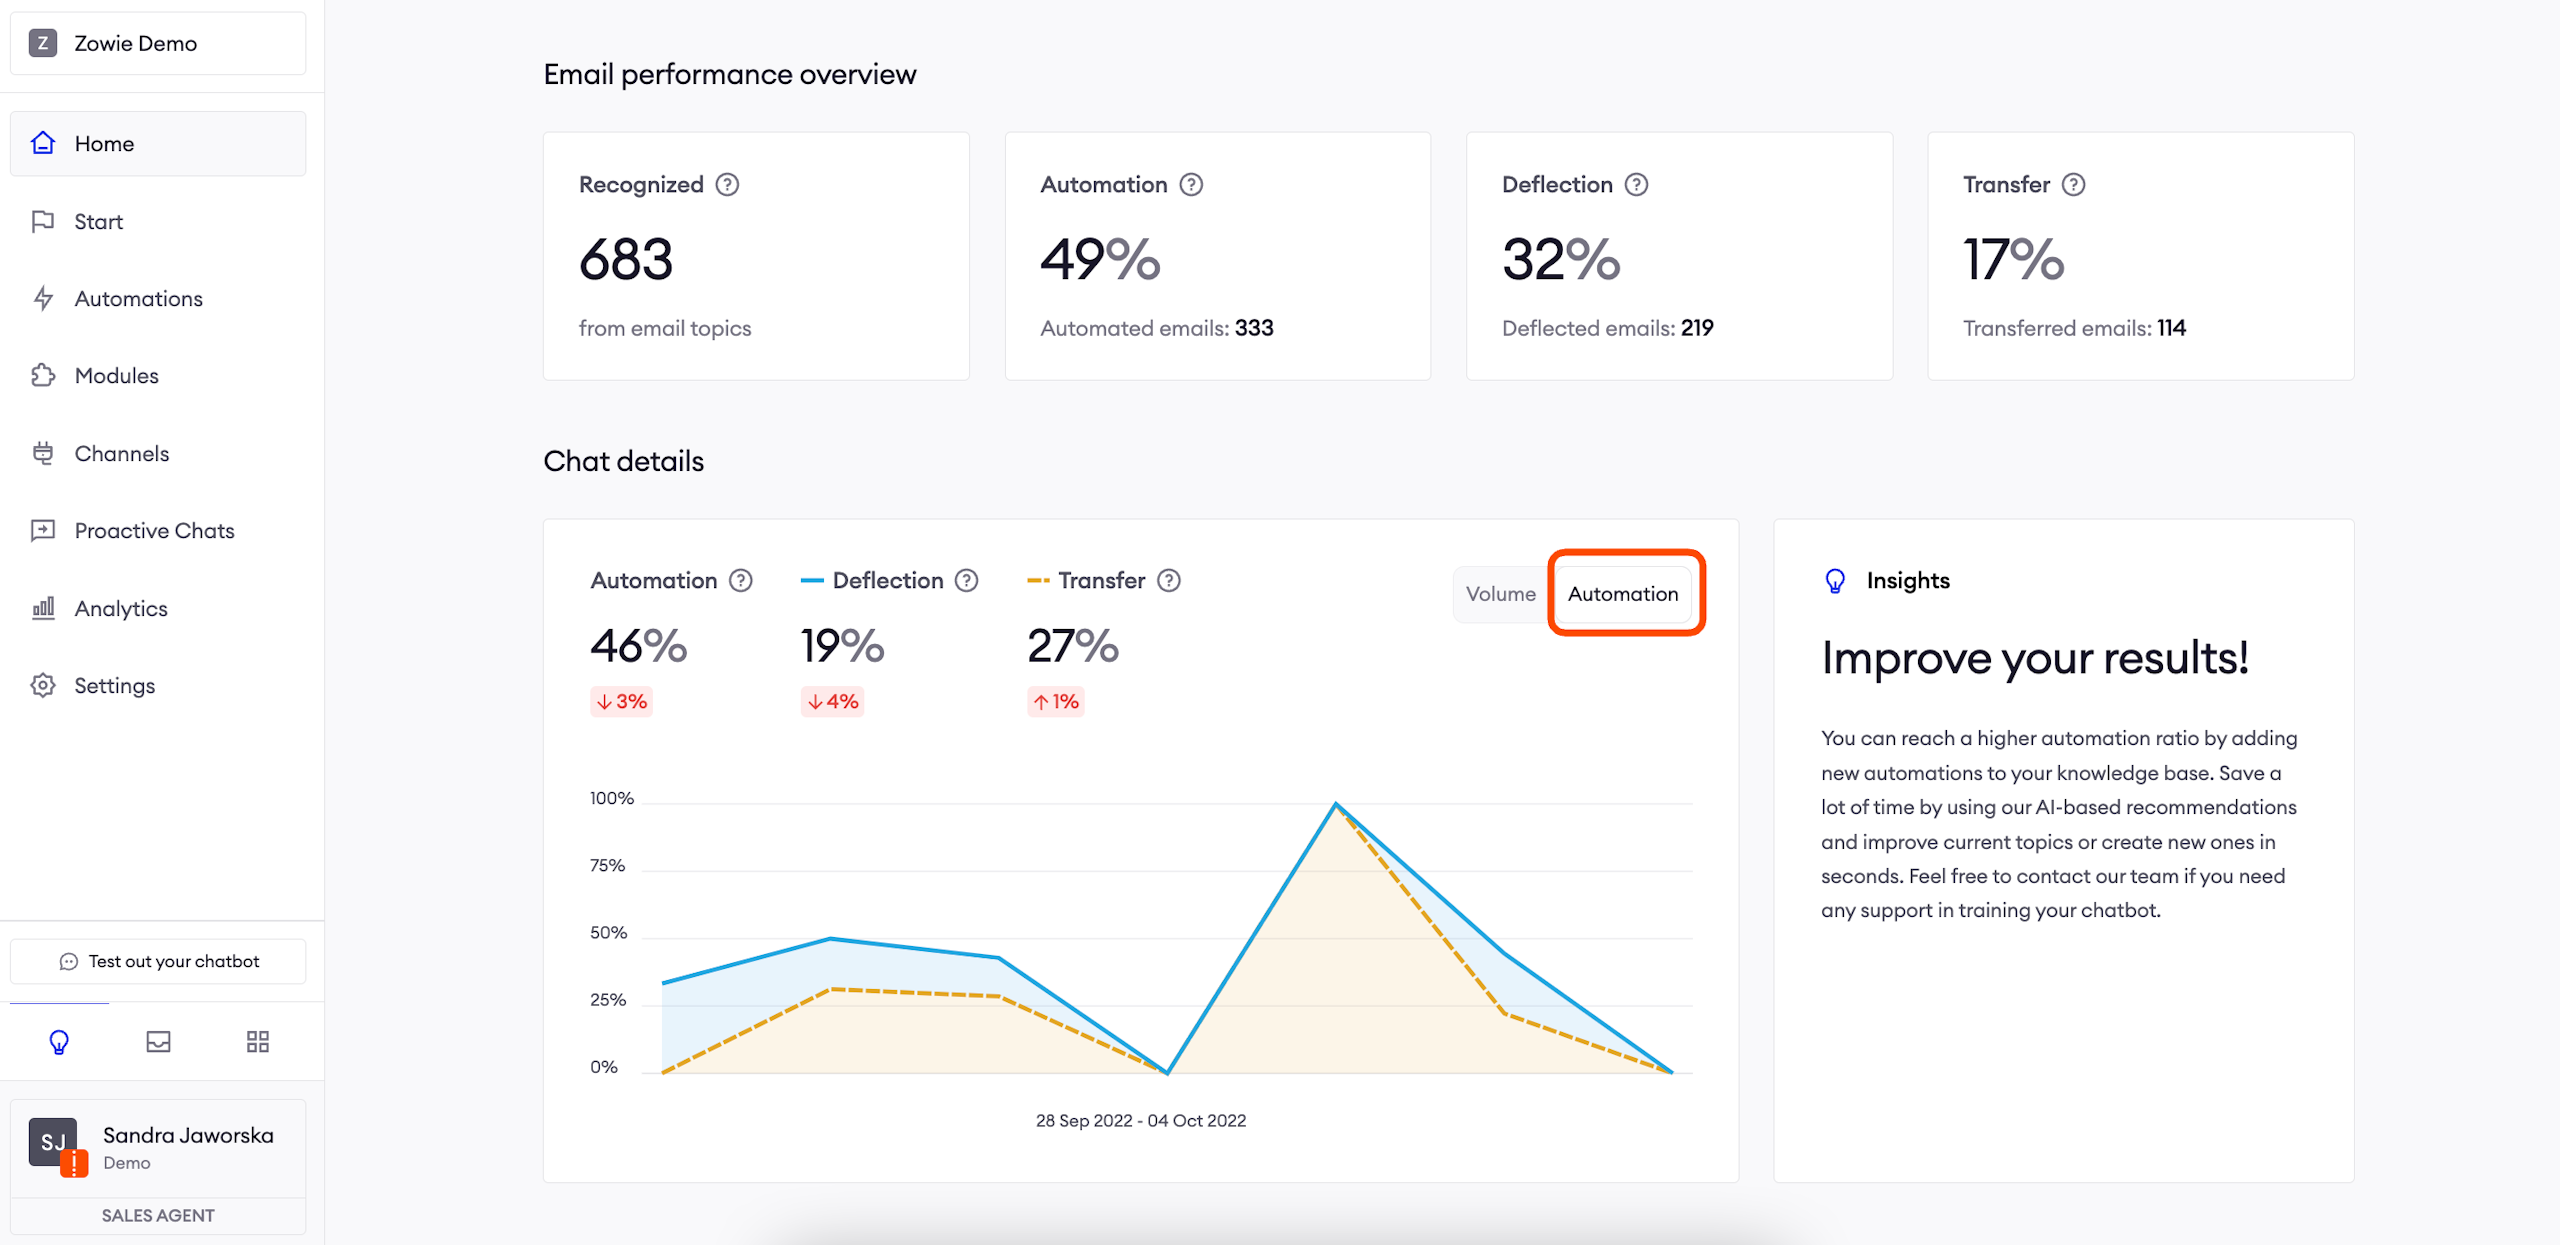
Chat details
The two charts displayed in this section visually represent your Performance Overview data. You can switch between Volume statistics and Automation statistics for the selected period. On the right, you have our Insights that’ll help improve your results.
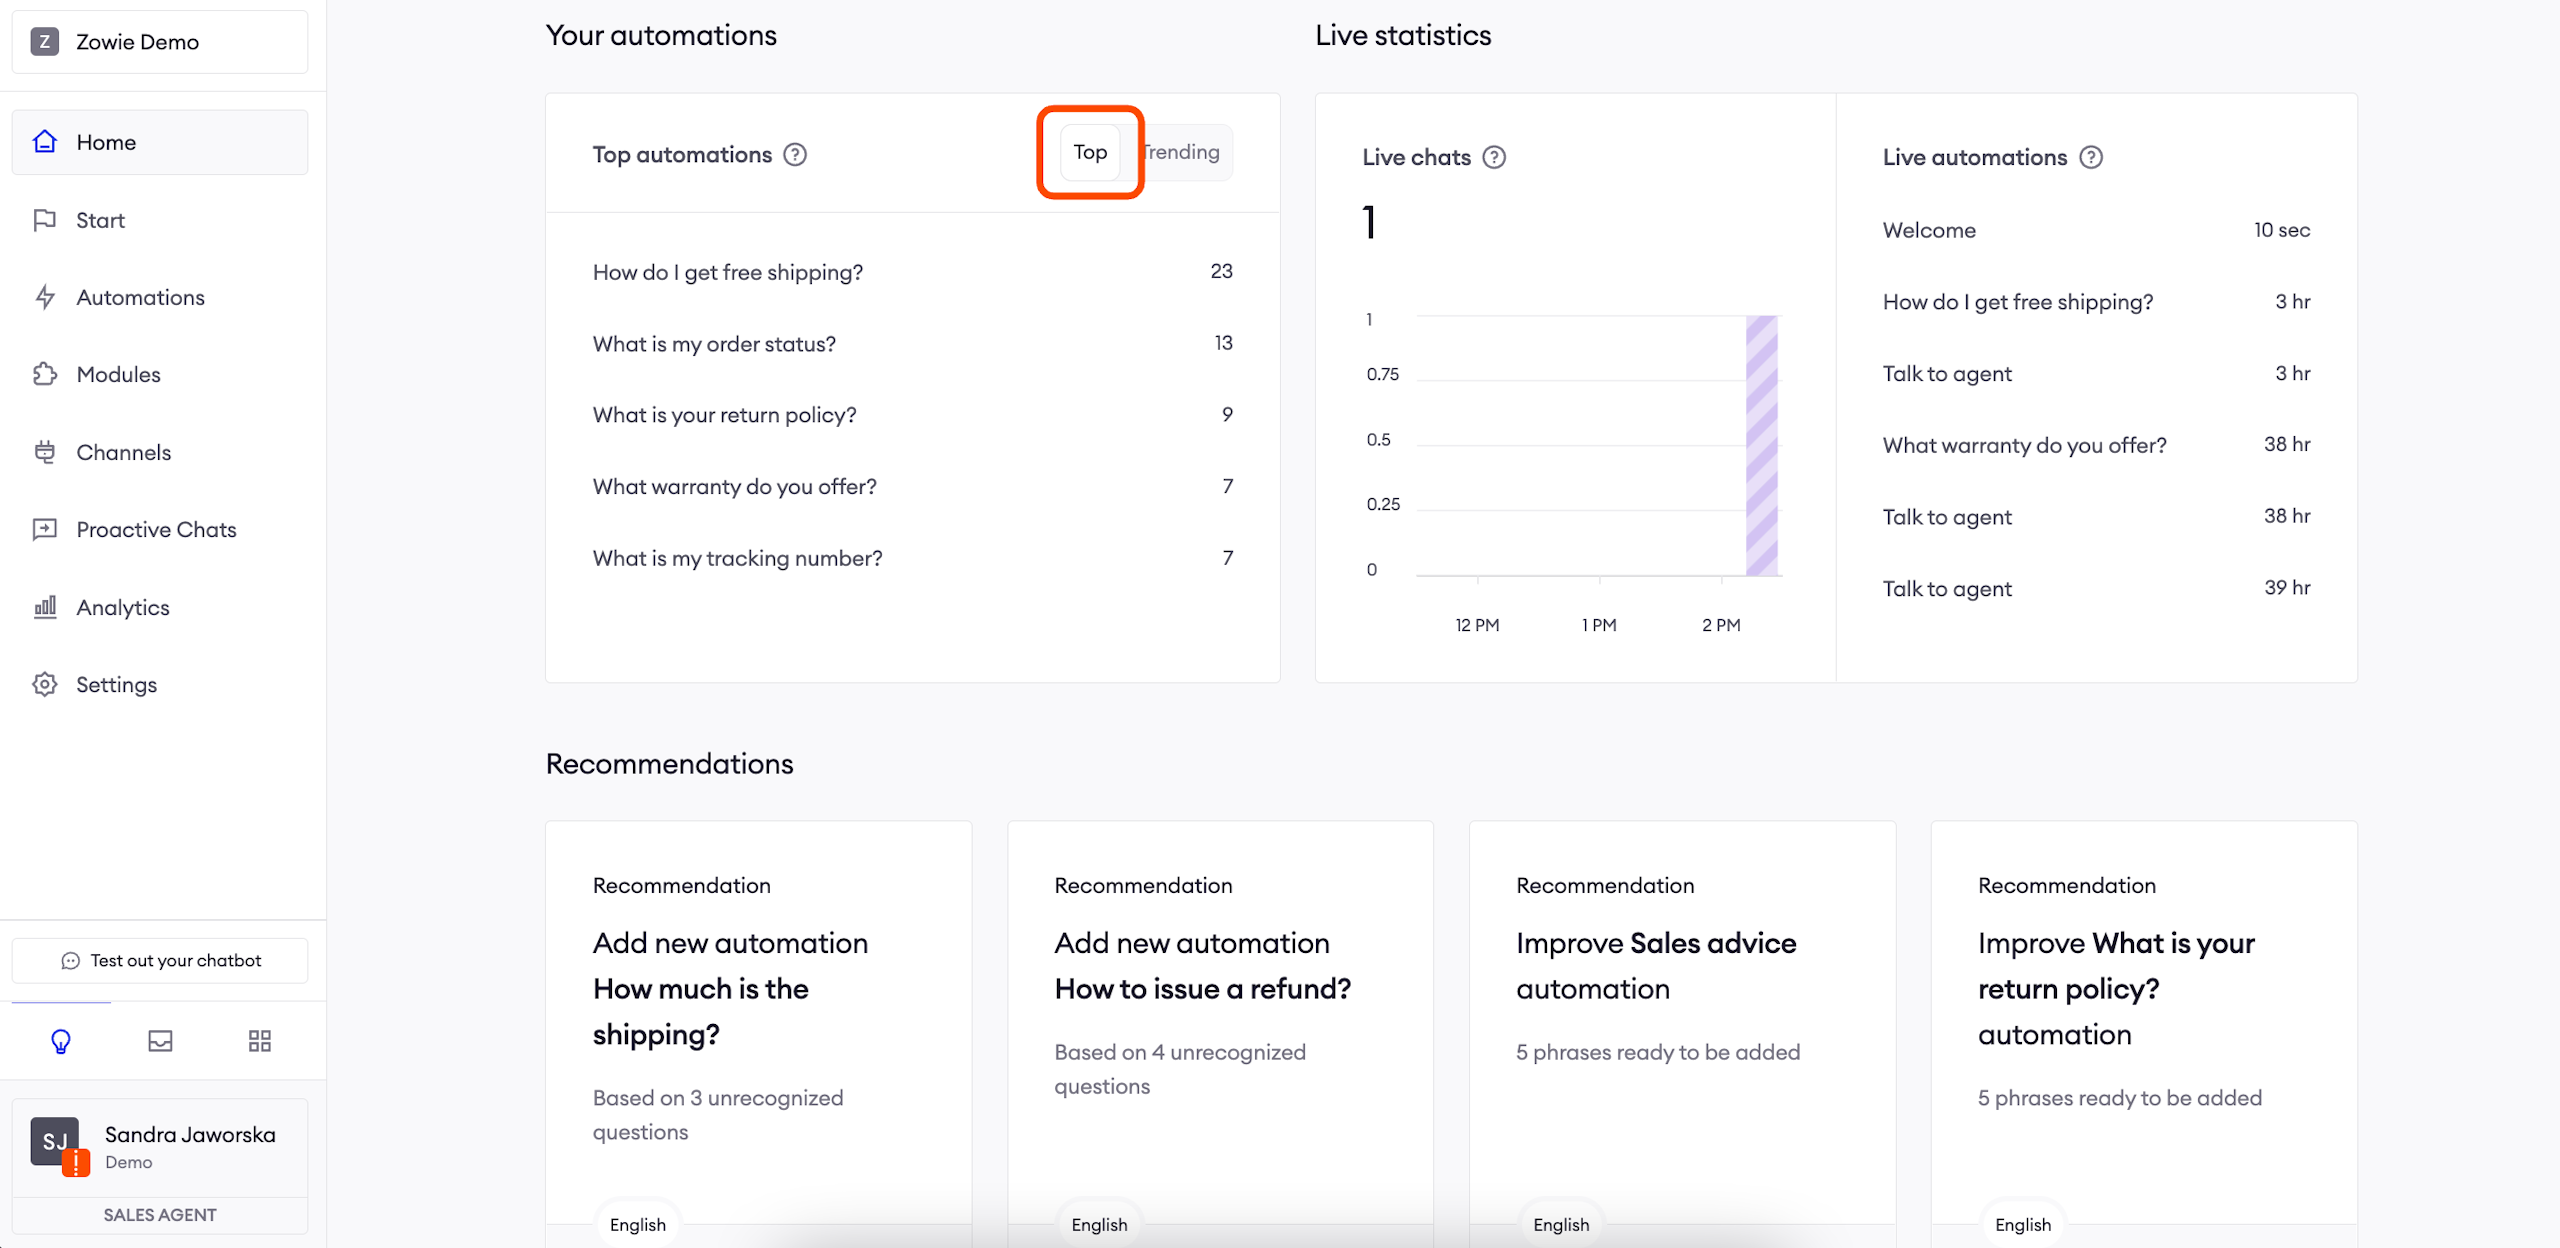
Your automations
Top automations show which Automations your users are triggering most often. The list displays Automation names along with the number of times users triggered each.
AttentionThe How do I get free shipping? Automation has a 300% increase compared to the previous period, which means that in the previous period it was evoked 5 times.
In the Trending Automations section, you can see the Automations which were triggered most often when compared to the preceding period. This info allows you to see changes in trends and adjust to user needs.
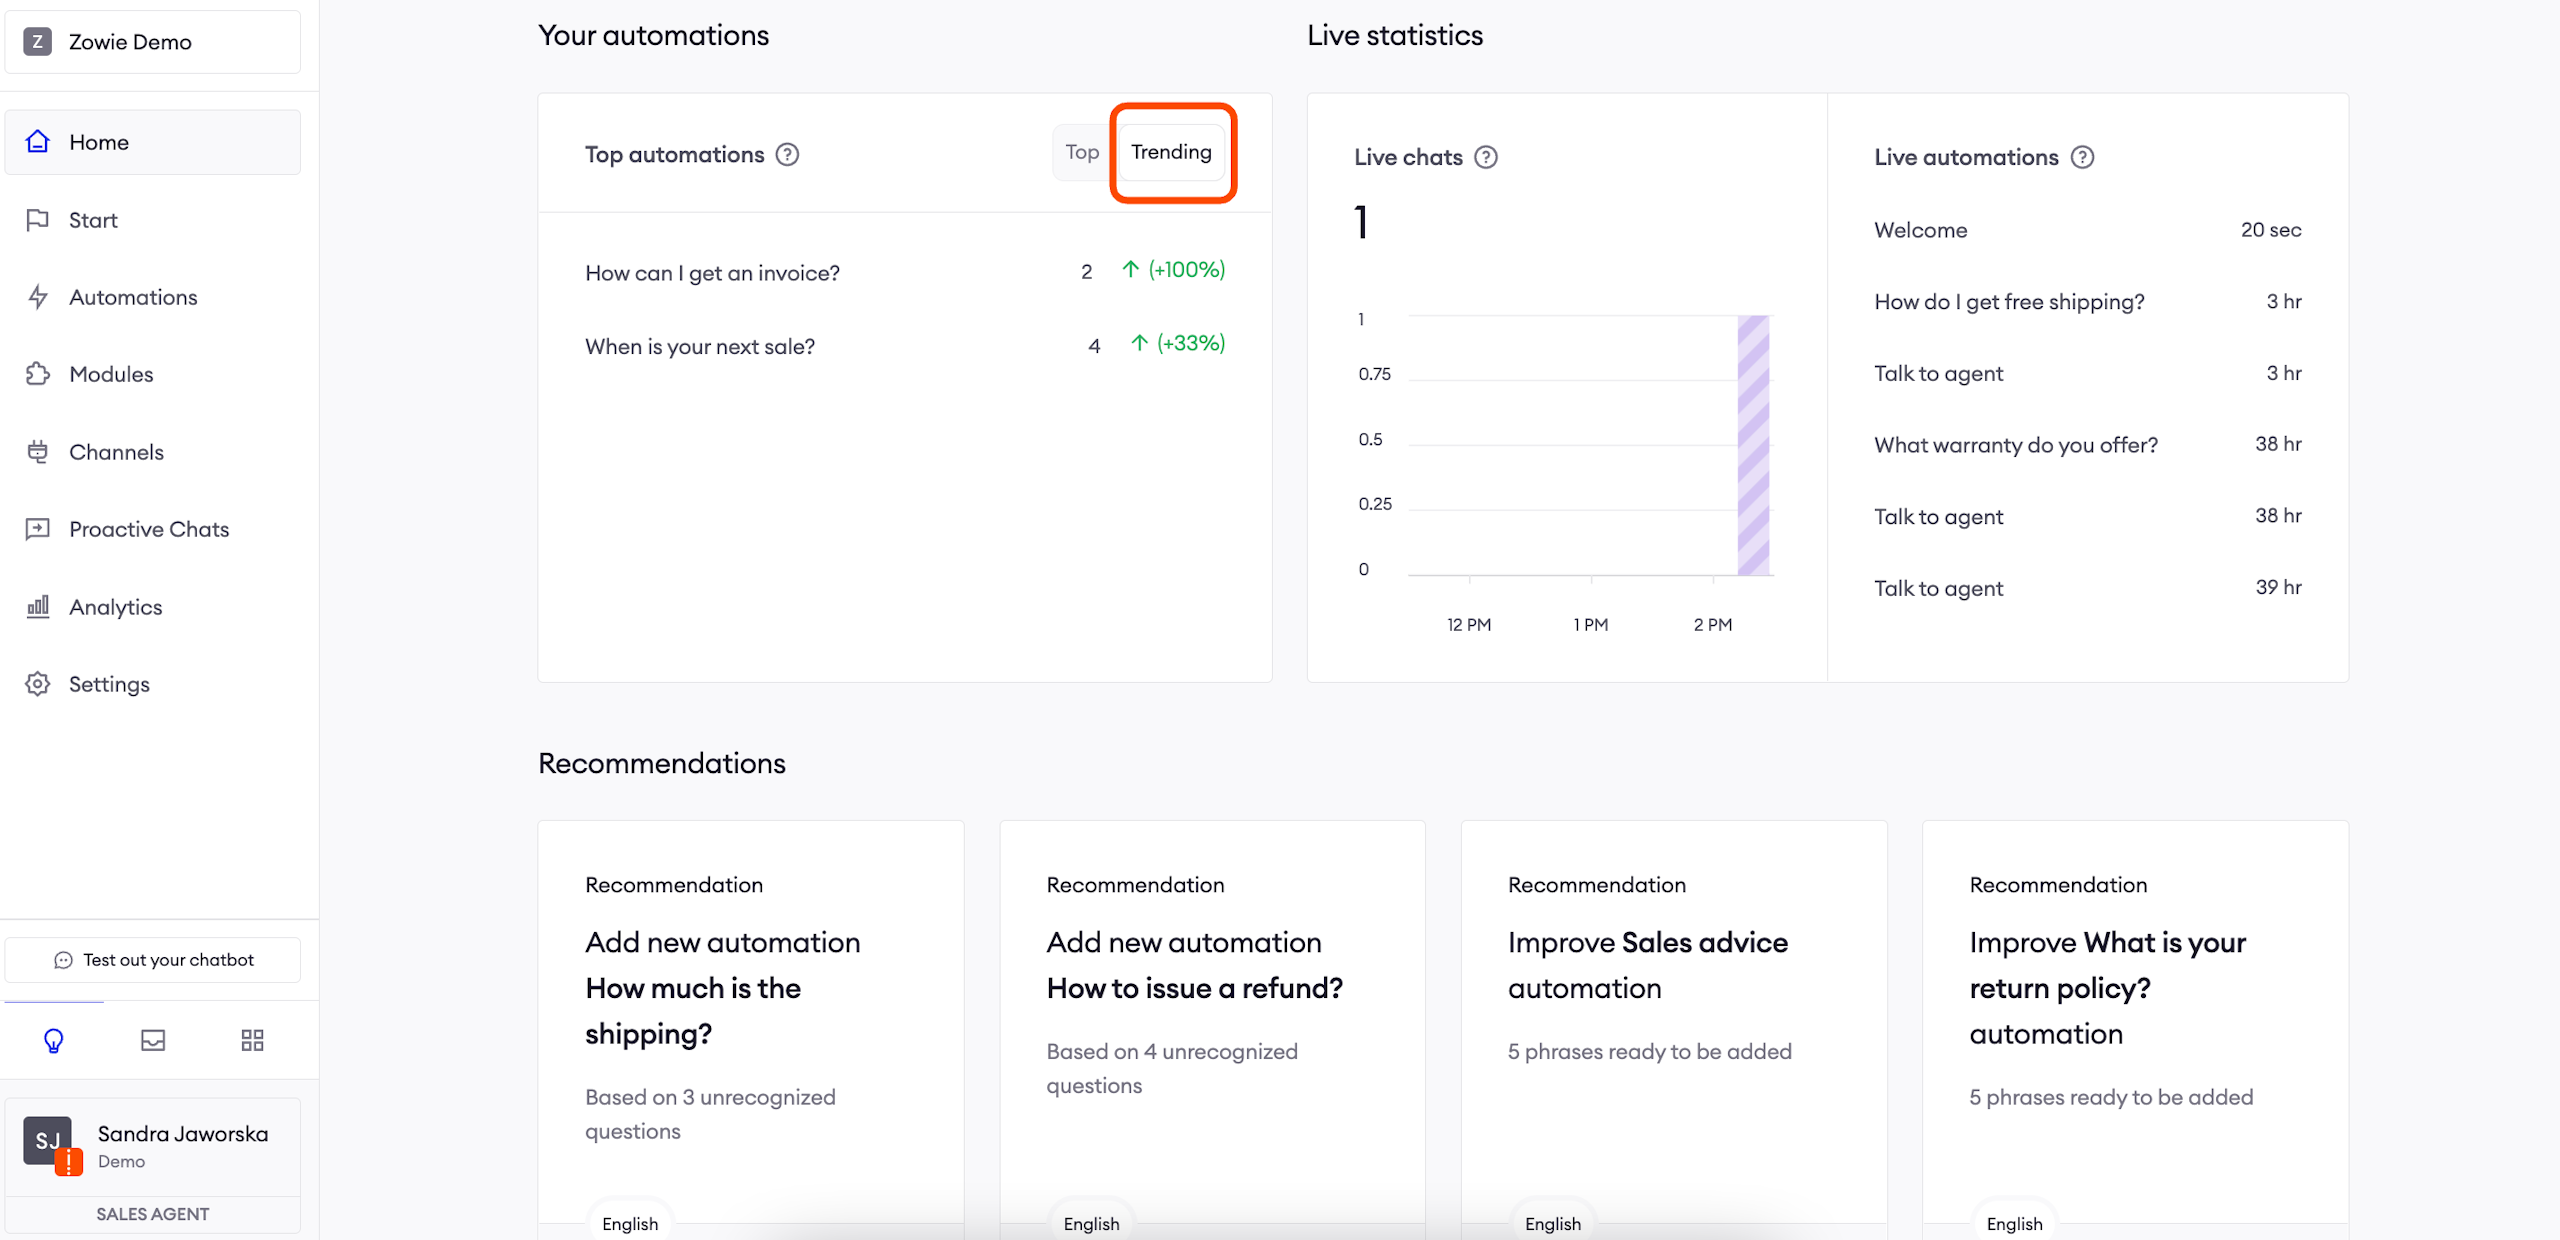
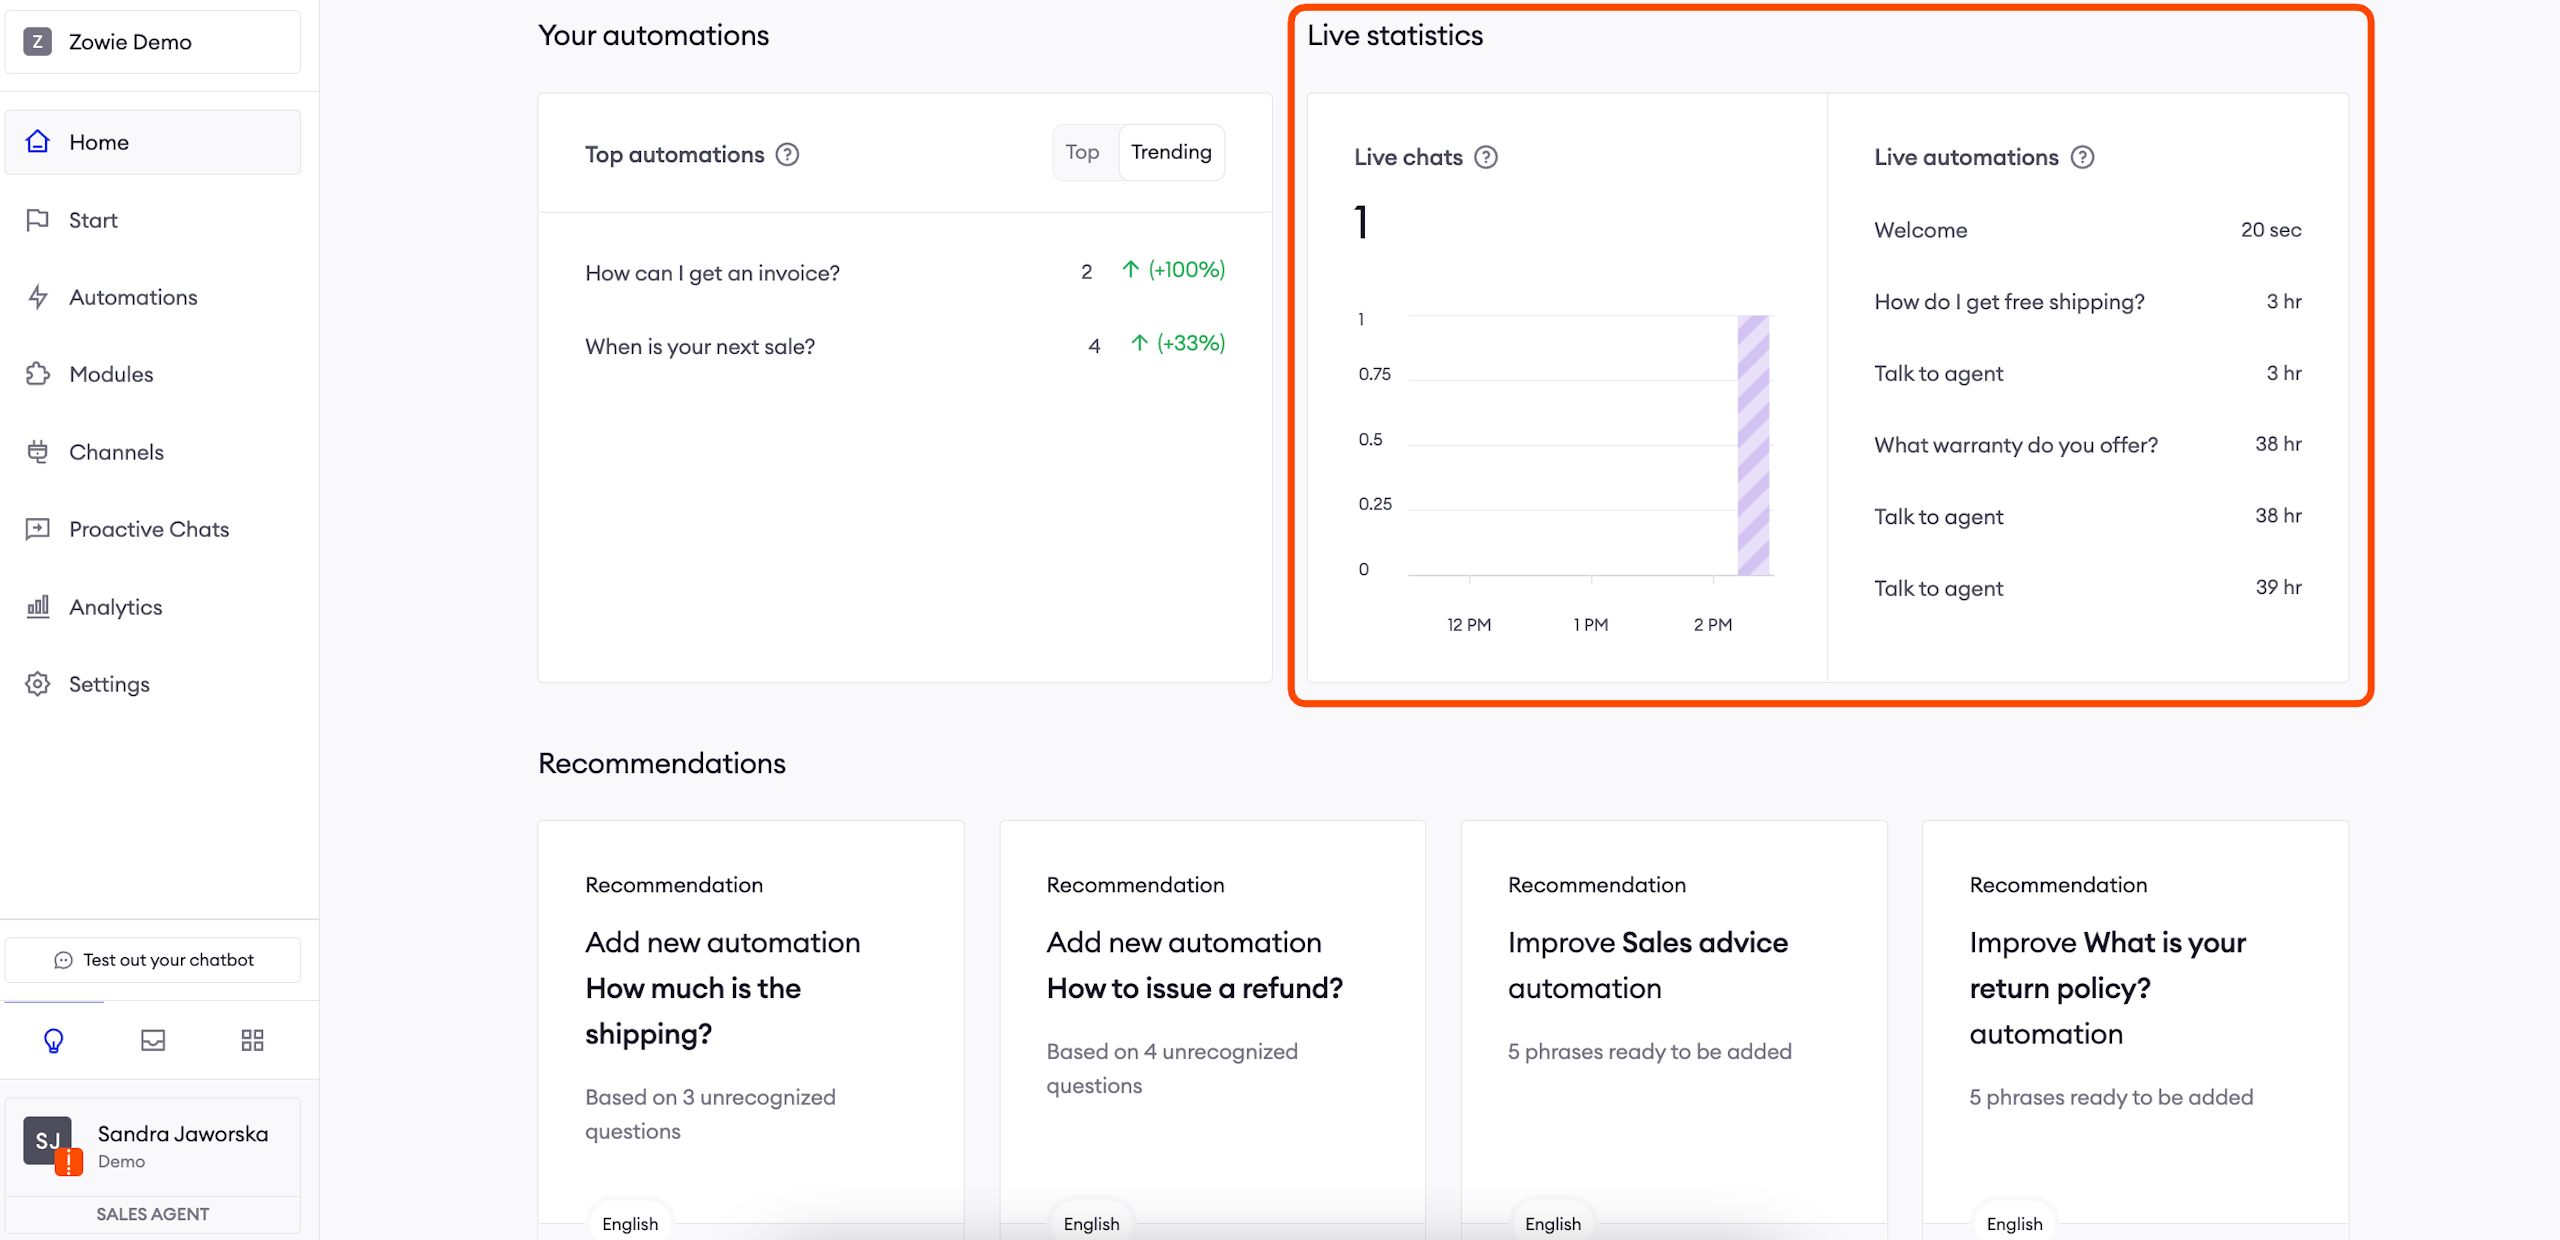
Live statistics
This graph displays live chats and changes based on real-time user activity. On the right, you can see your recently triggered Automations. This section allows you to understand your users' needs better in real-time.
AttentionImagine you just enabled a sale on your website. You can see that Automations My promo code isn't working or I can't add an item to my cart are peaking which may suggest that you should tweak some things on your website.
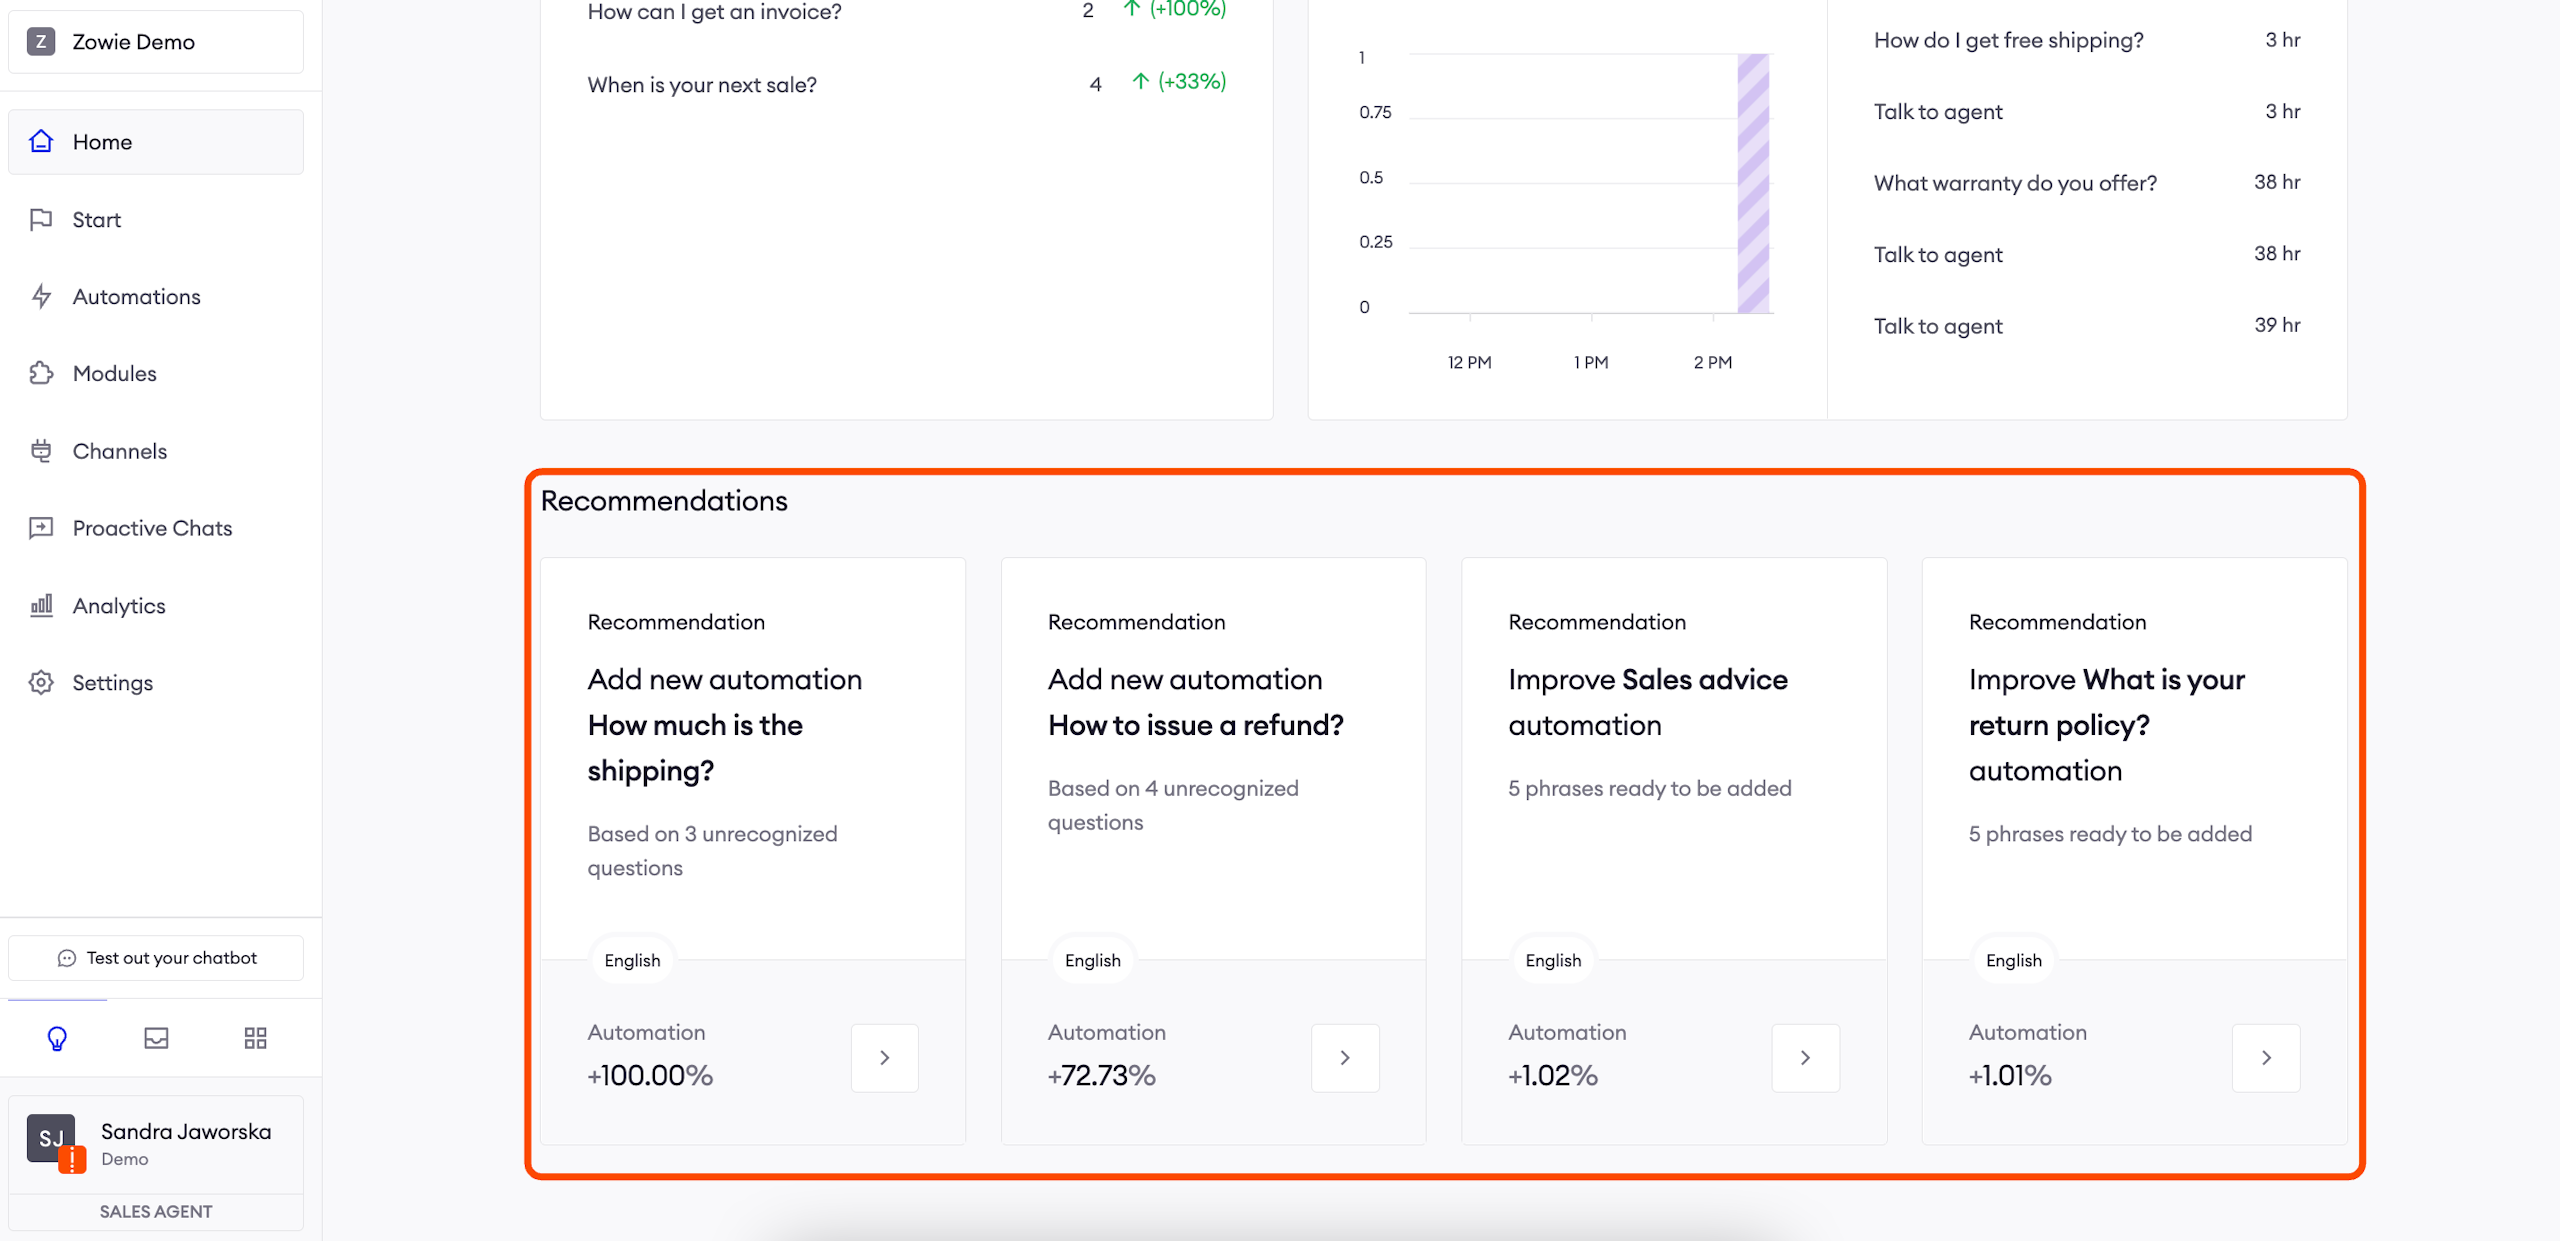
Recommendations
This section is helpful when you want to train your chatbot using the insights obtained from your Home Dashboard analysis. You can see our AI-generated Recommendations based on your user interactions, along with how much each will increase your automation rate. After clicking on a Recommendation, you’ll be taken to the dedicated Recommendations section.