General Analytics
What is General Analytics?
General Analytics shows all the data regarding the overall performance of your chatbot.
Why use General Analytics?
General Analytics help you better understand how your customers interact with your chatbot. You can see the overall traffic, sources of this traffic, modules performance, and more useful insights.
How to access General Analytics
To access the General analytics tab, navigate to Analytics > General Analytics from Zowie's navigation bar.
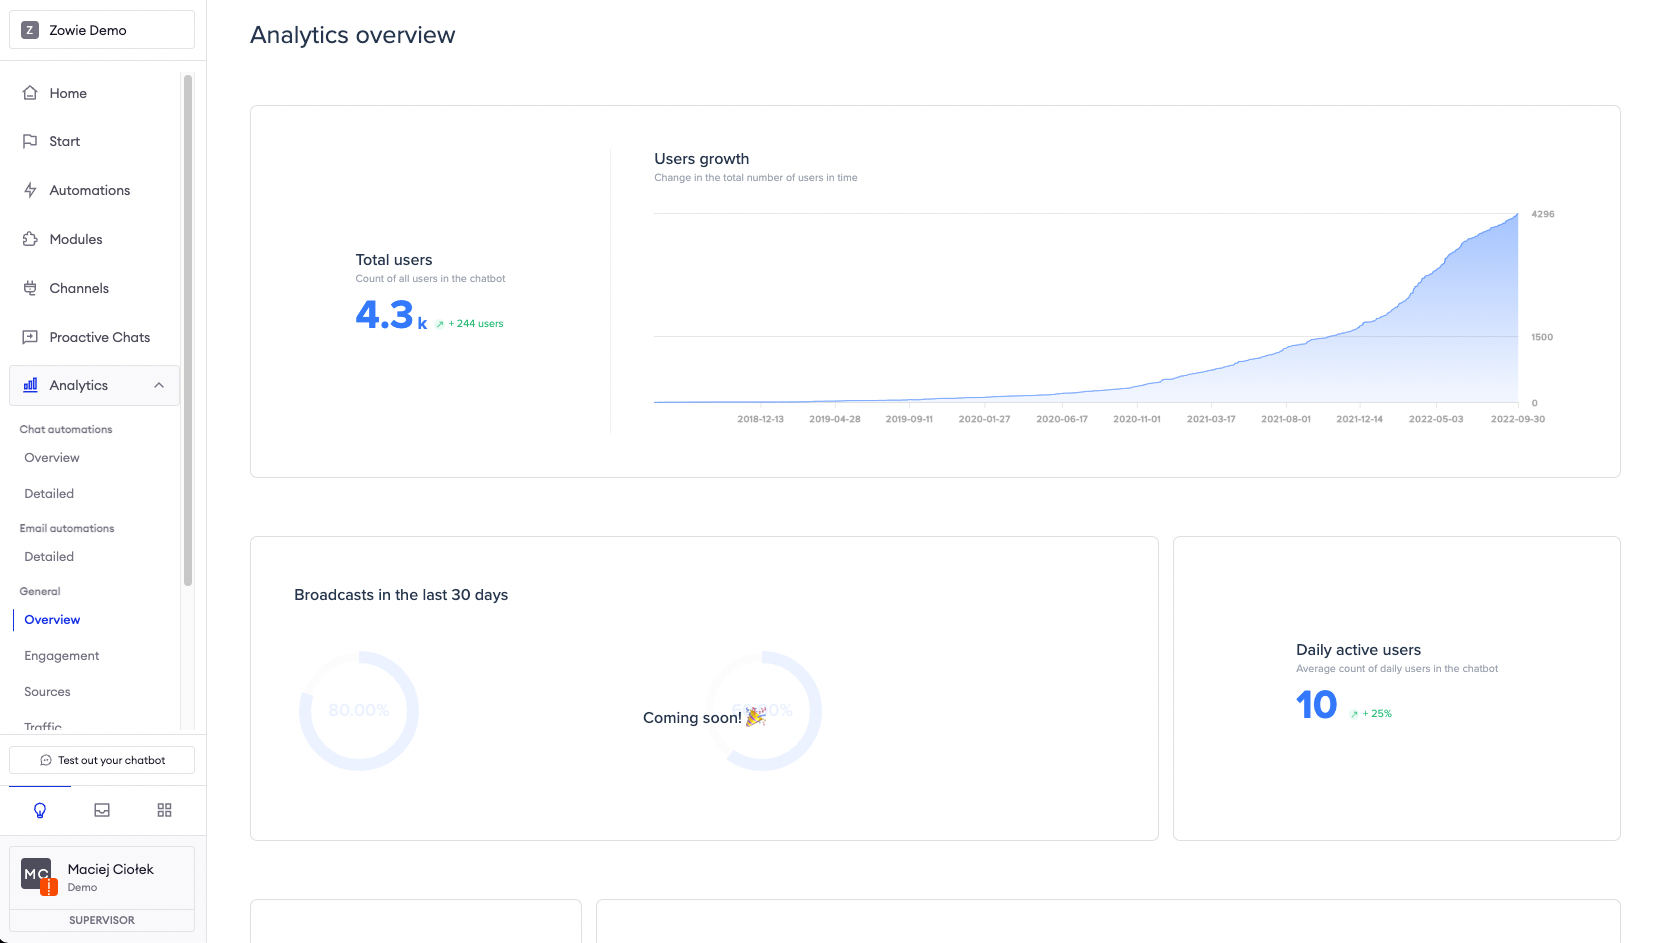
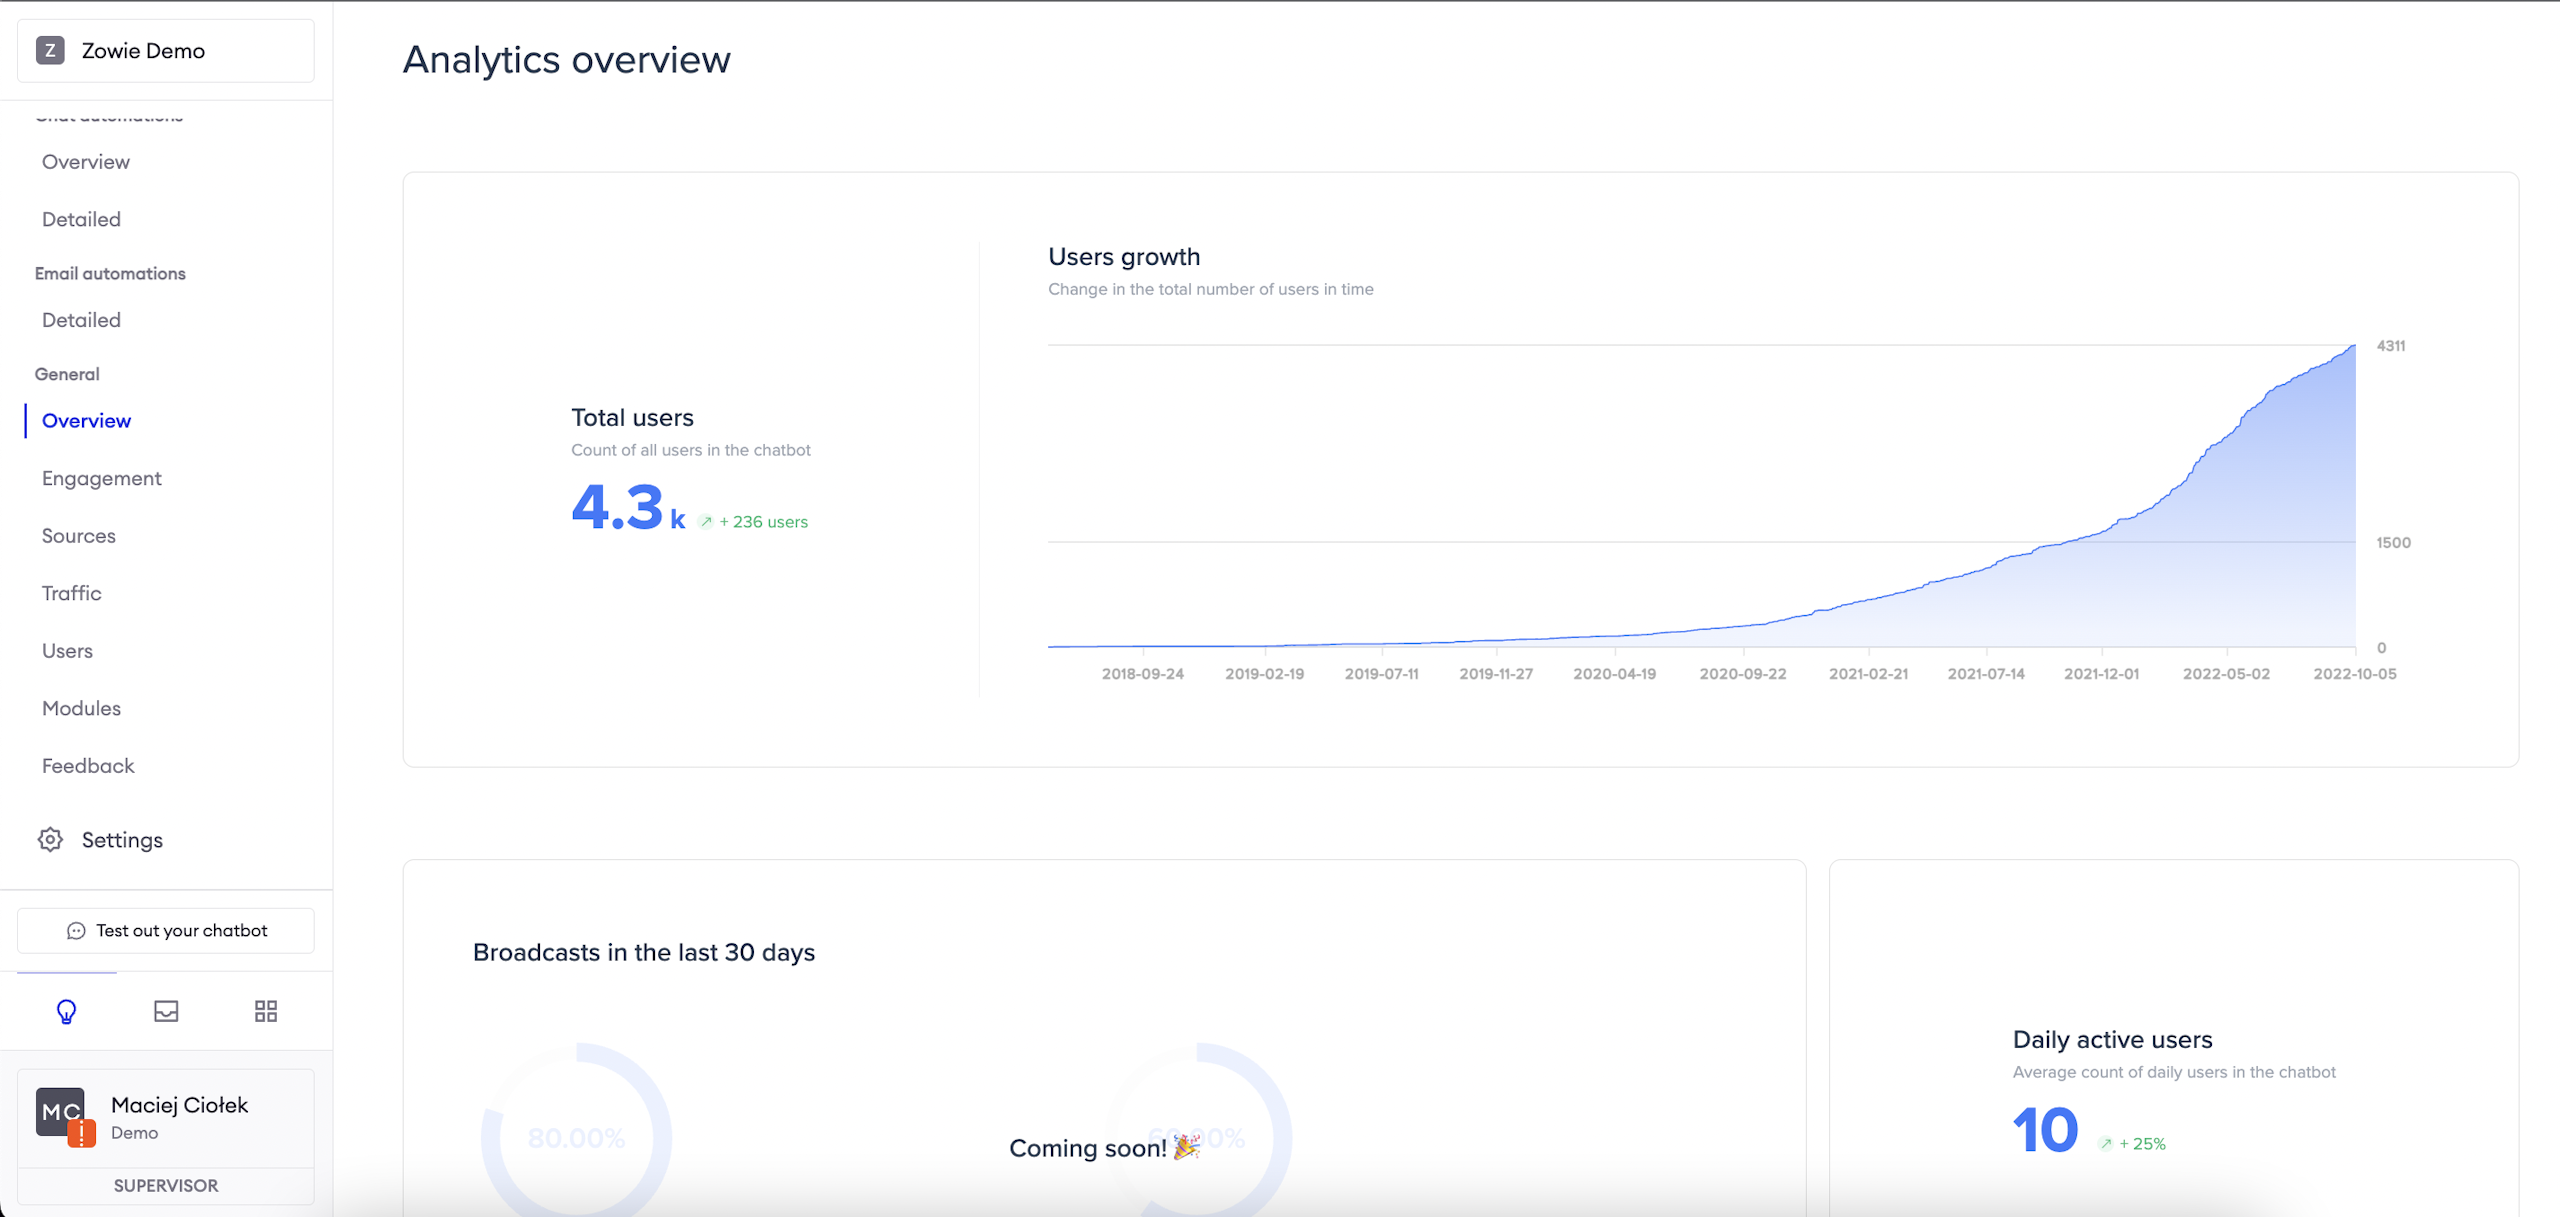
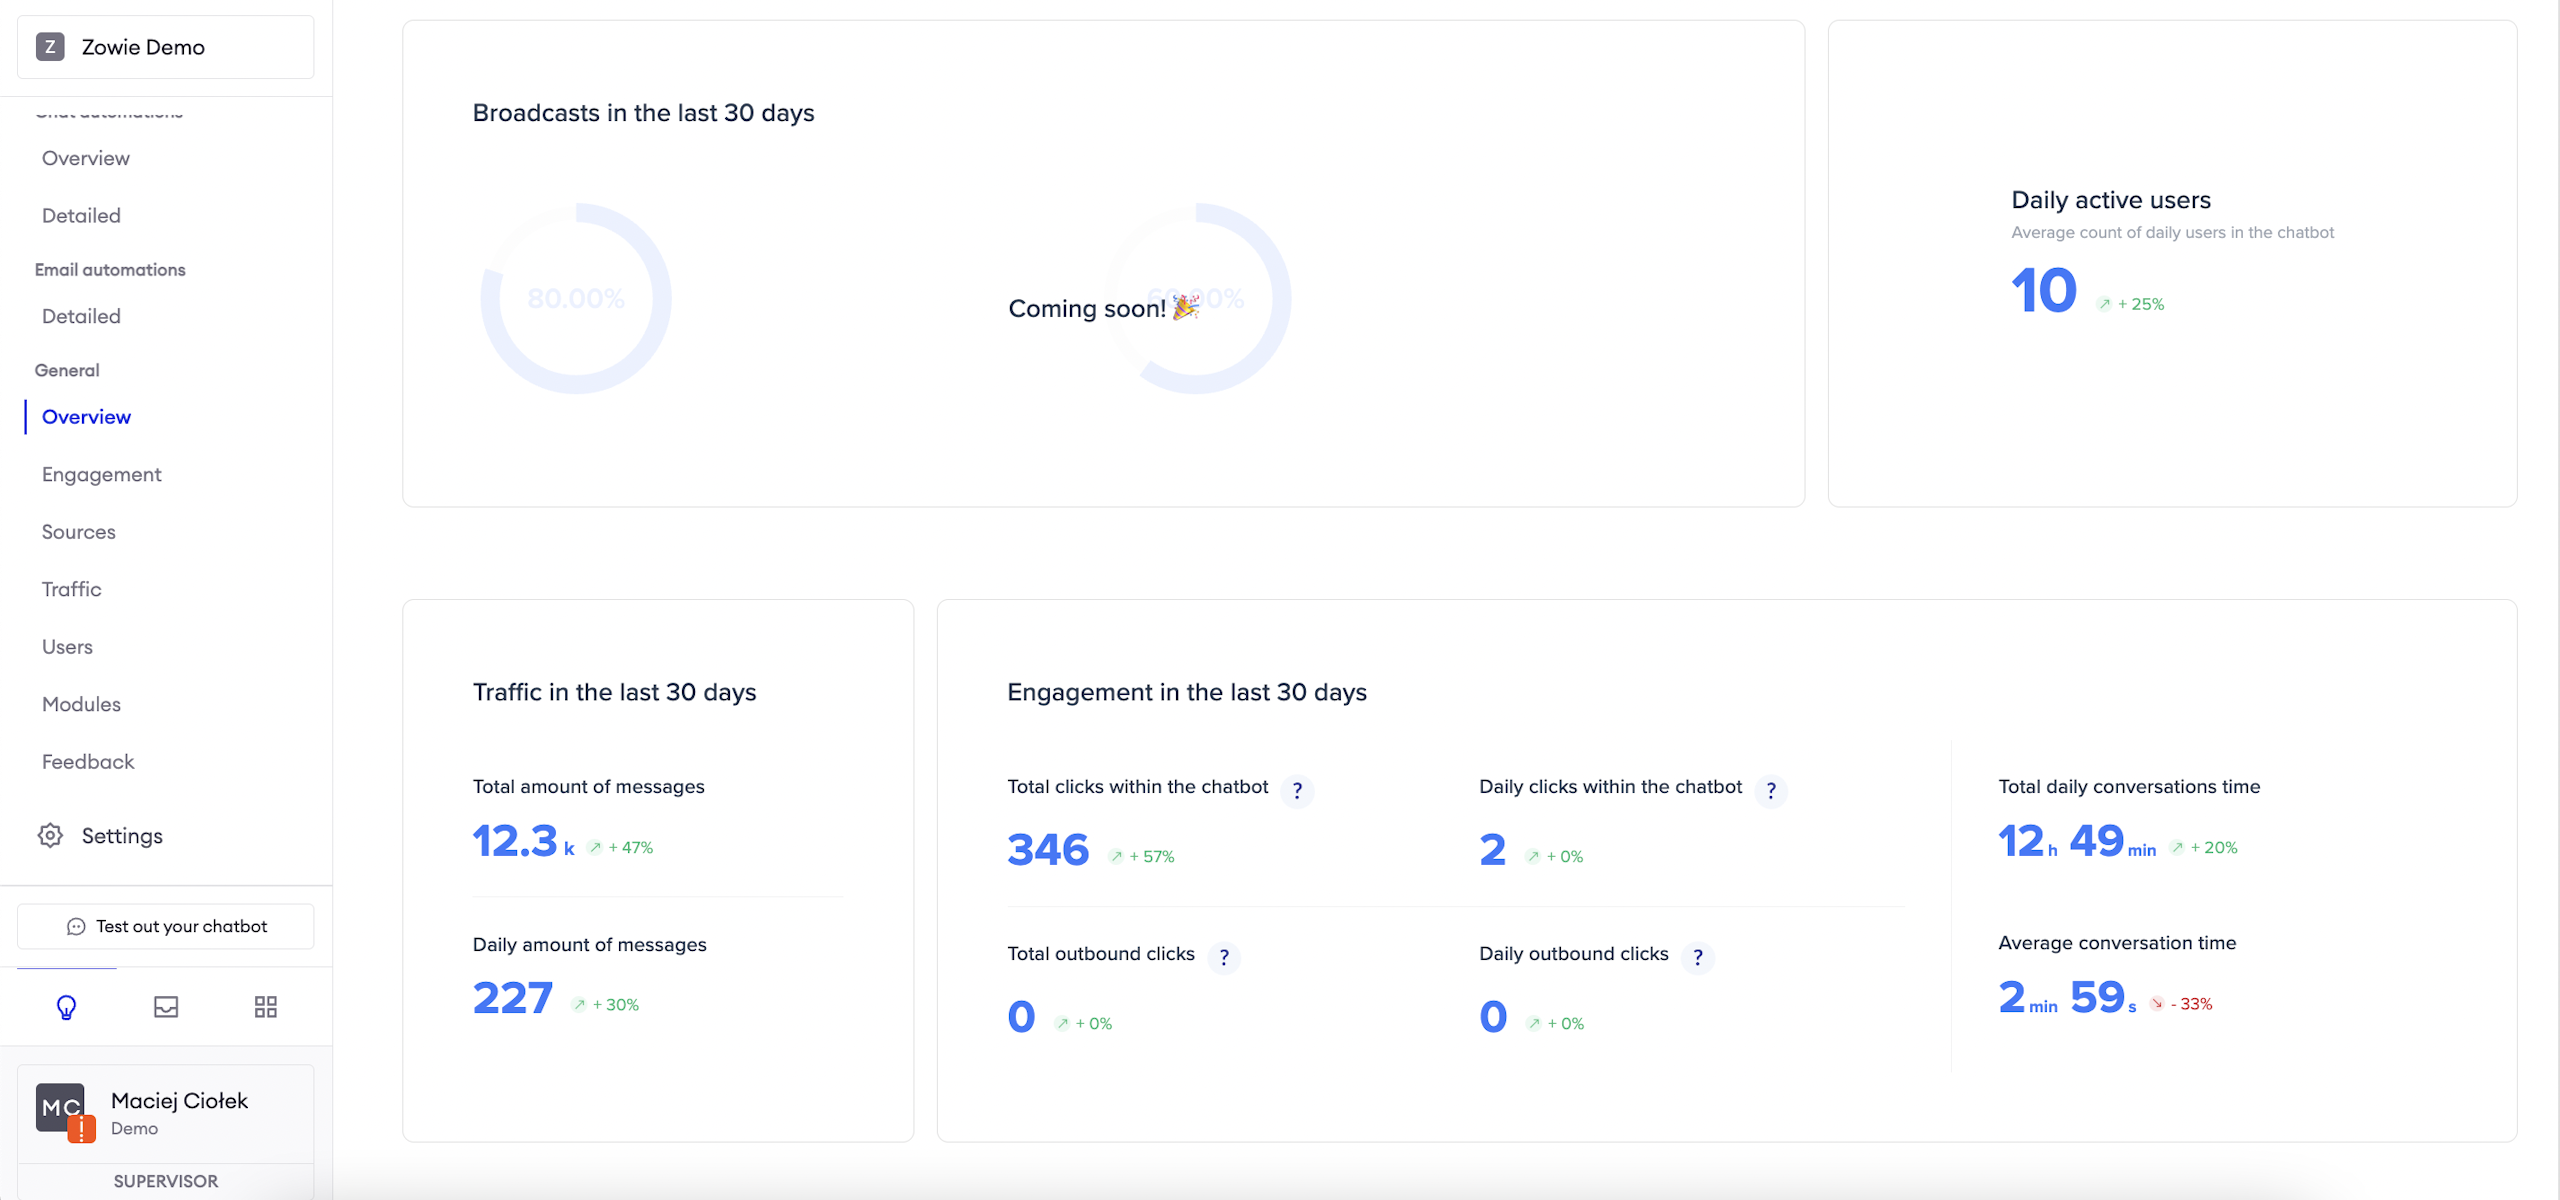
Overview
The Analytics Overview allows you to get inside many essential metrics like Total Users and Daily Active Users in your chatbot as well as Traffic and Engagement (e.g. clicks, conversations time) in the last 30 days.
AttentionPlease, rewrite it in a way that it cites sections of the platform (for example, Total users instead of total number of users). Also, remember it's number if it's countable, amount if it's uncountable.
I also fixed the buttons, remember to use the format agreed in the guidelines in the future.
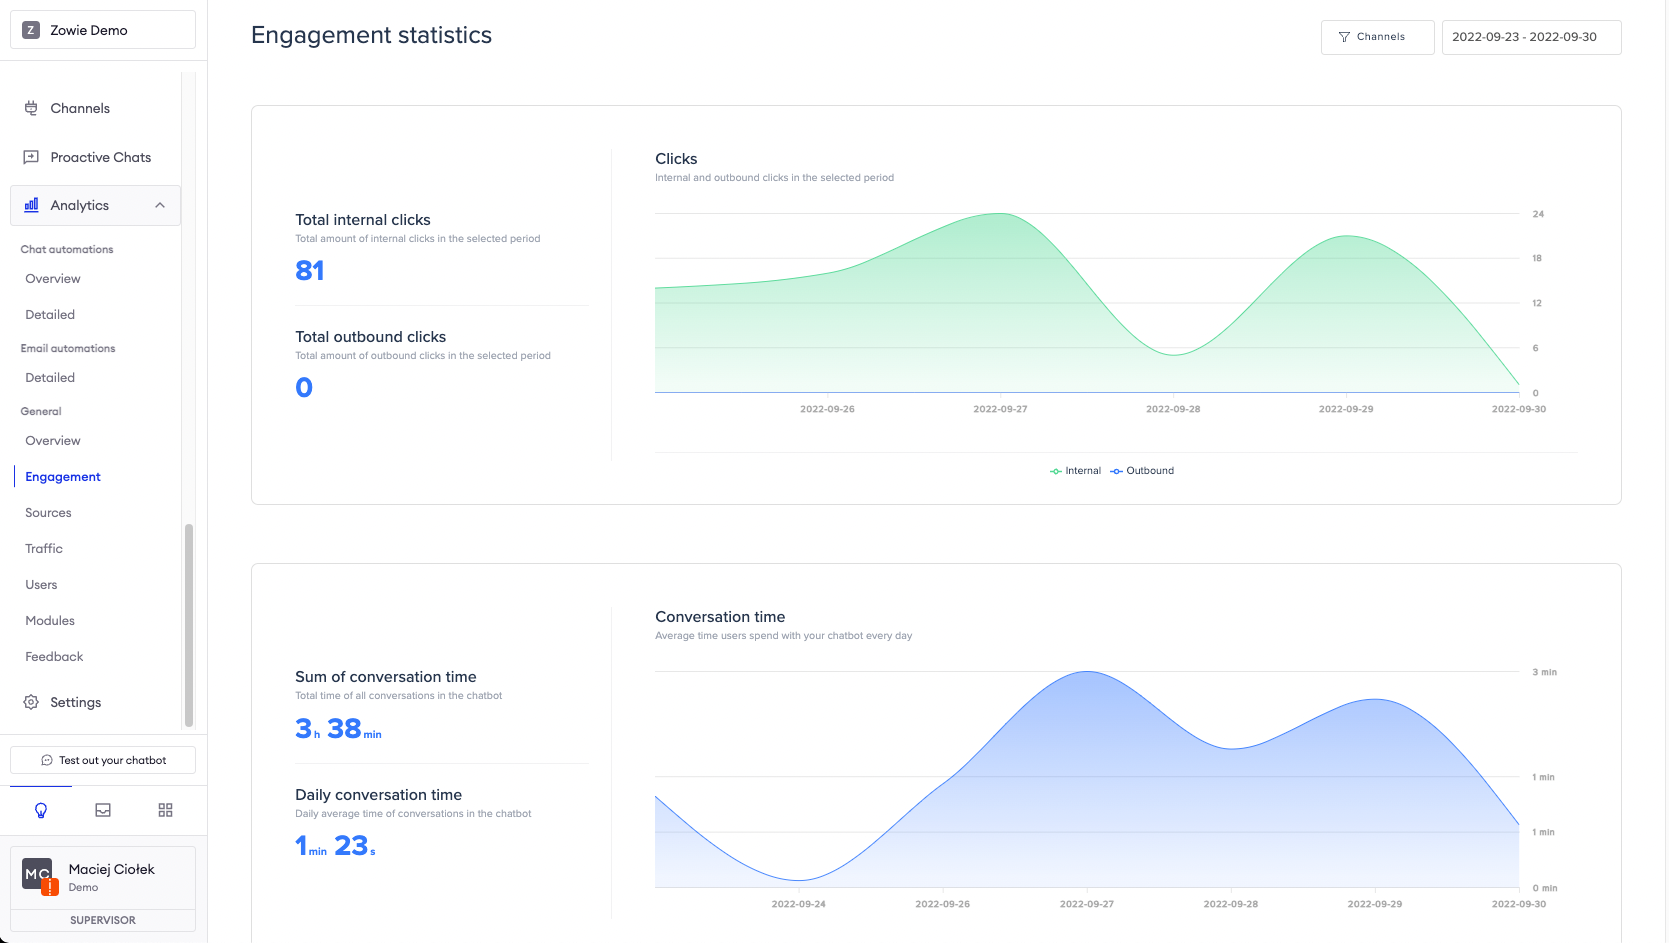
Engagement
The Engagement panel offers more insight into the inbound and outbound clicks in the chatbot. The inbound (internal) clicks are those that are performed as an action in the chatbot, e.g. clicking on a quick reply. The outbound clicks are those that move the user out of the chatbot, for example to an external website.
The Engagement panel also provides information about the total time that the chatbot has been conversing with your customers, as well as an average daily conversation time.
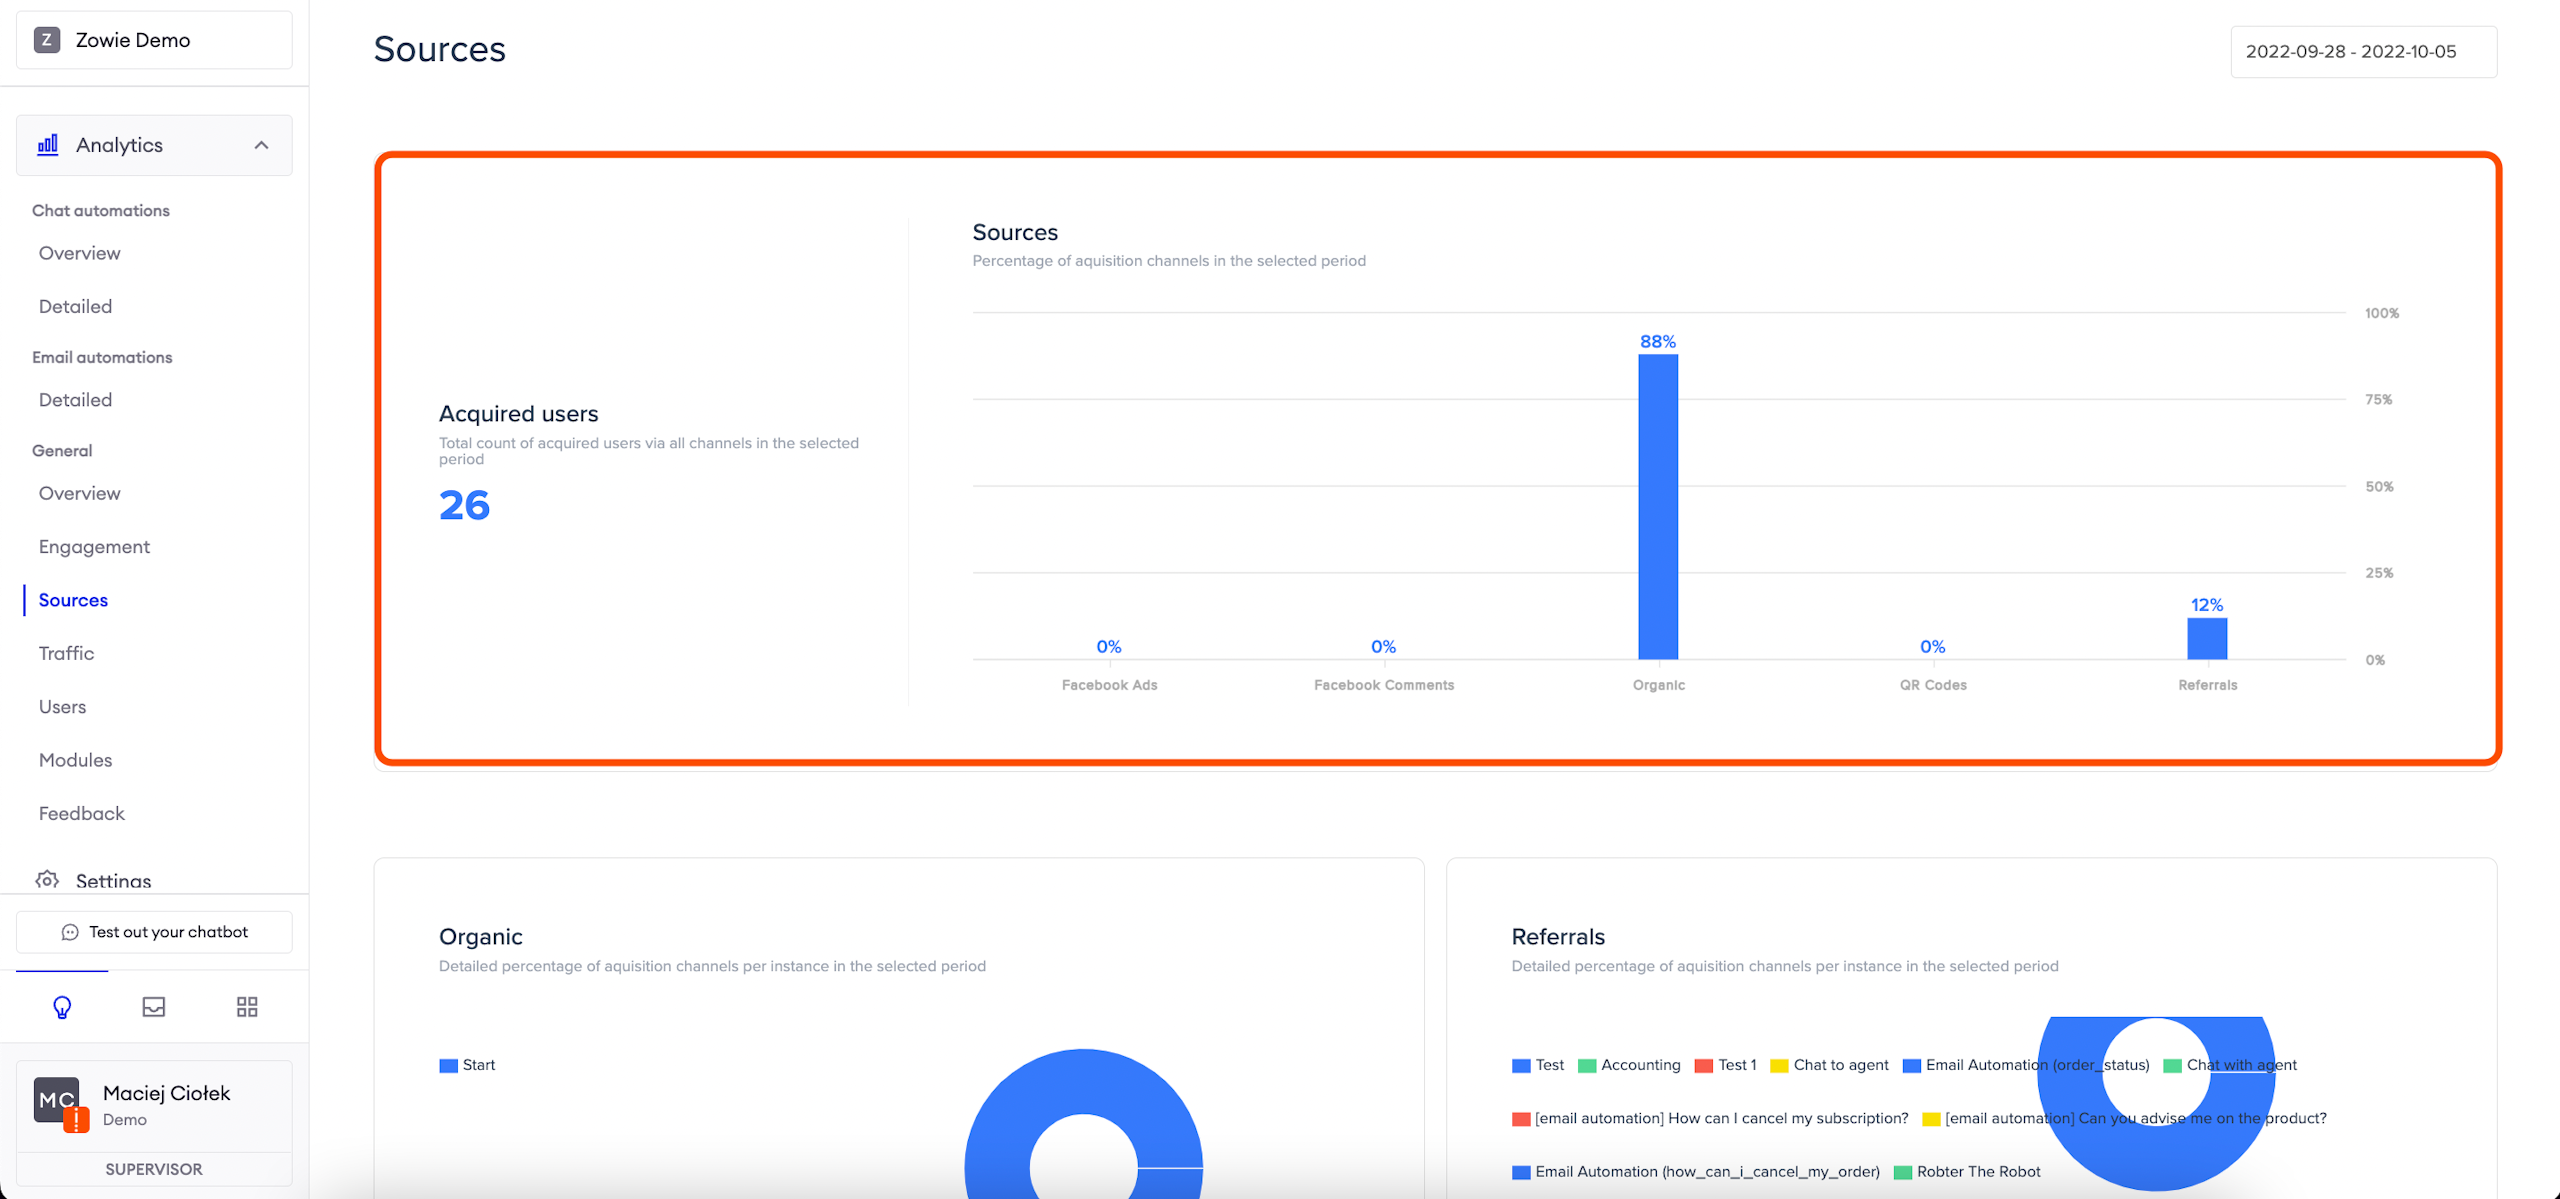
Sources
The Sources tab provides insight into the sources of acquired traffic–whether it was organic traffic from the place where you embedded your widget, QR Codes, Referrals, Facebook Ads or Facebook Comments.
The detailed percentage of acquisition channels on the pie chart is displayed below.
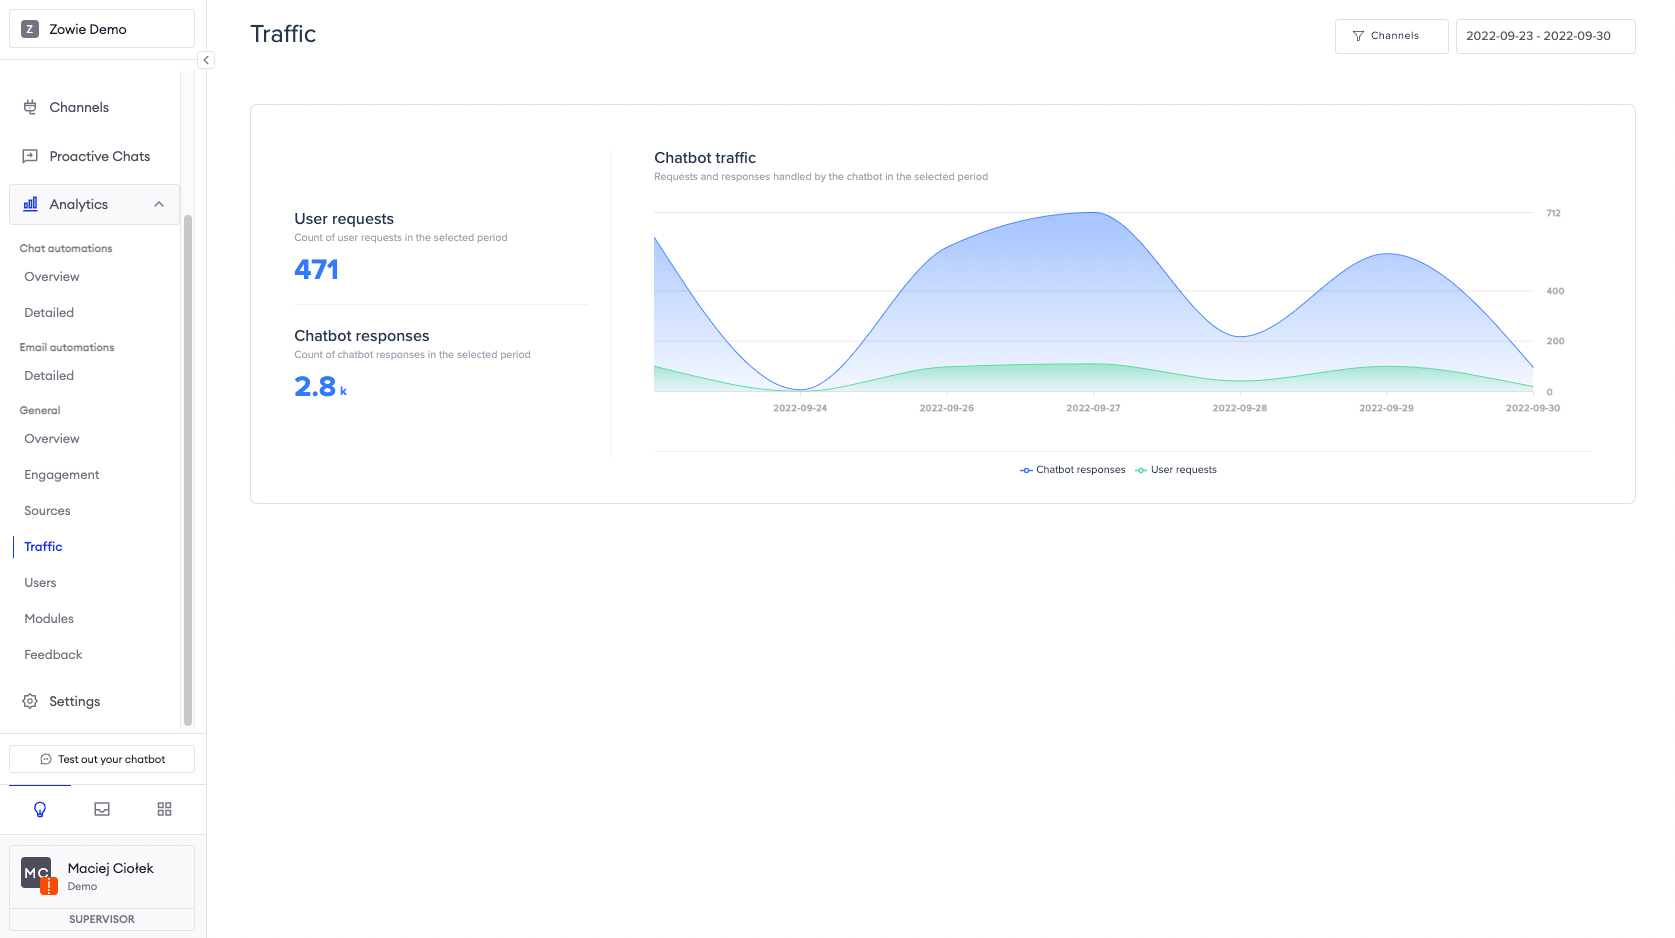
Traffic
The Traffic tab provides insight into the number of messages sent by your customers and the number of chatbot responses to said messages.
Usually, the number of chatbot responses is bigger than the number of user requests. That's because the chatbot tends to respond with more than one message, especially in case of longer Automations.
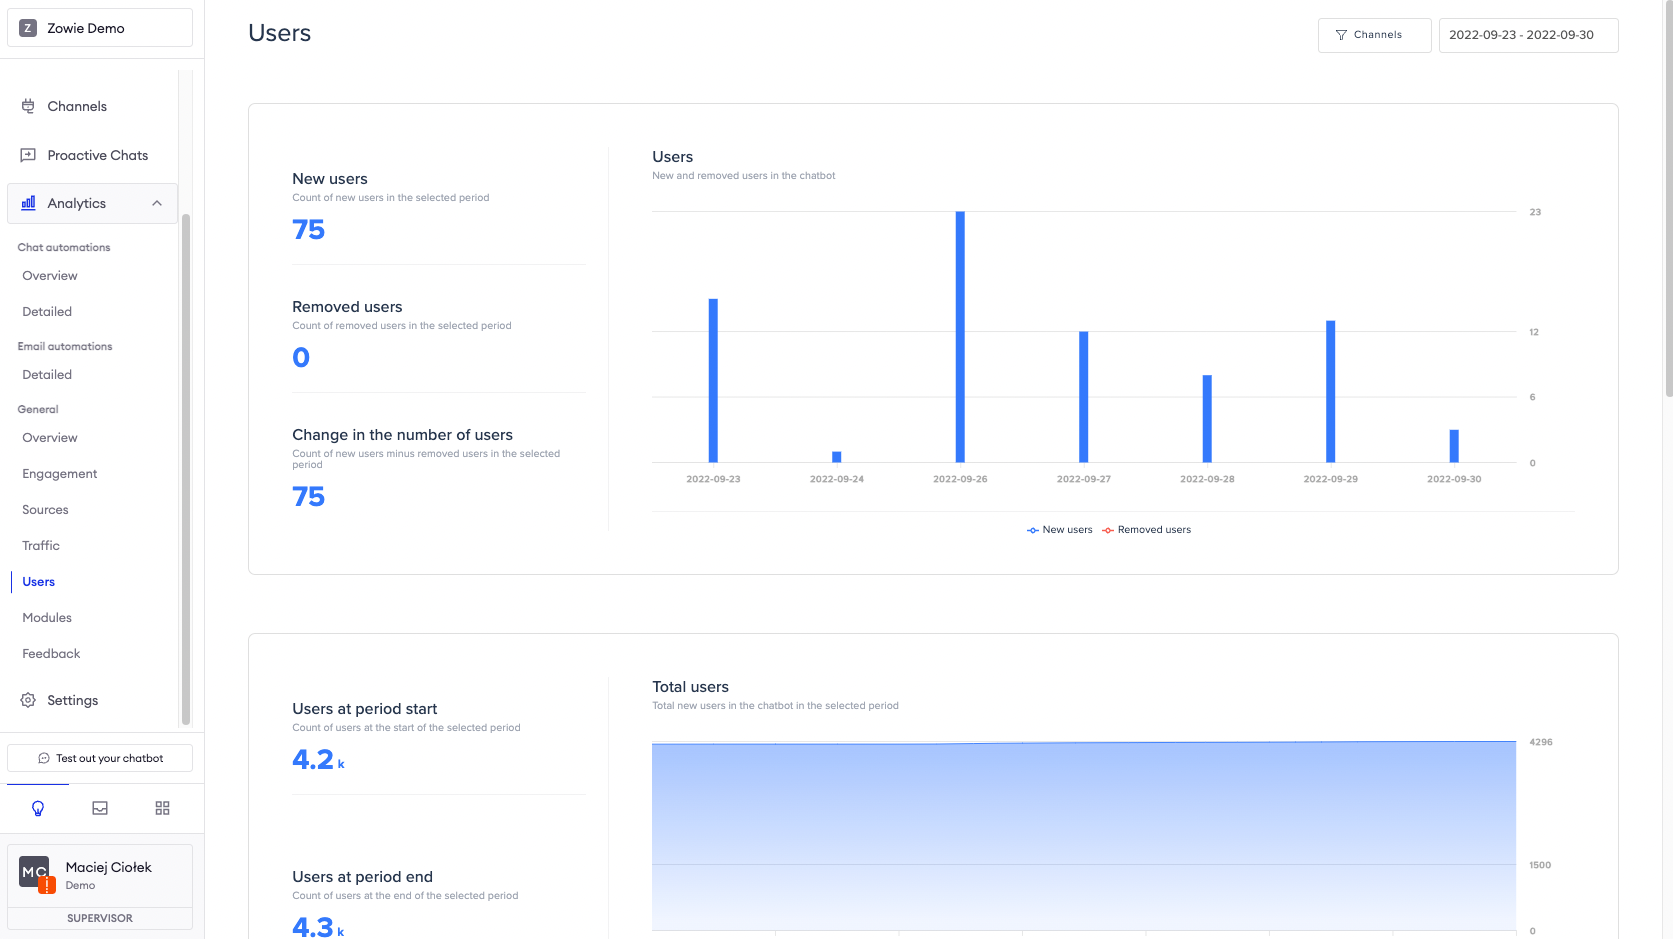
Users
The Users tab provides insight about new and removed users in your chatbot, as well as the change in the number of users in the selected timeframe.
Information about the number of users at the start of the given timeframe is displayed, as well as at its end.
The daily and total number of active users in the given timeframe is also provided.
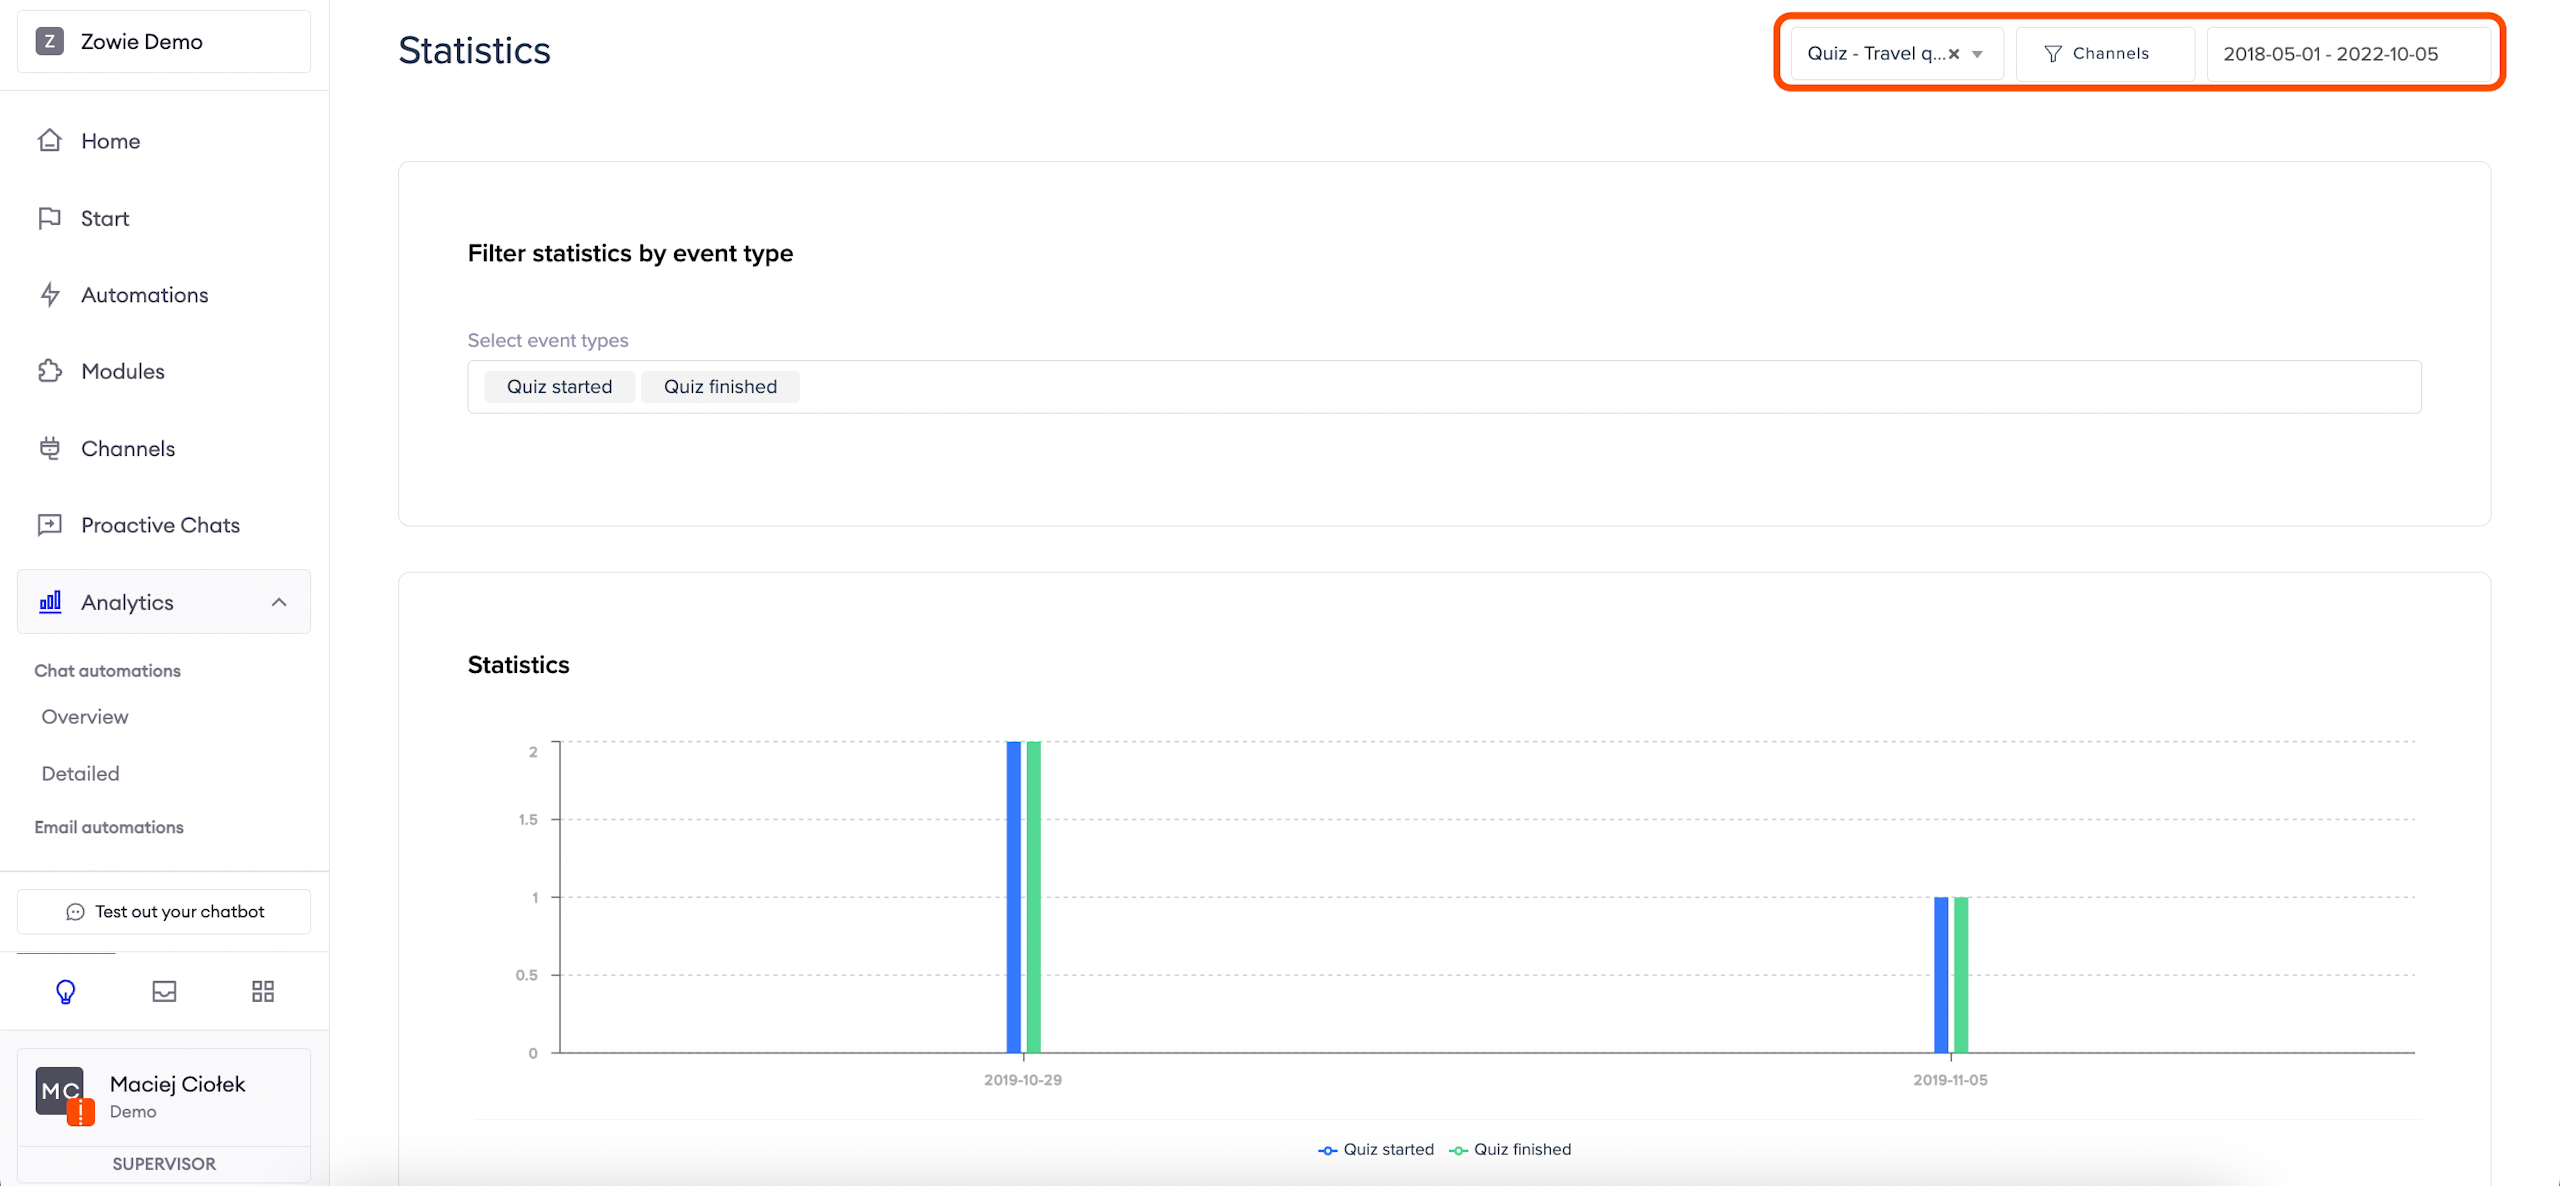
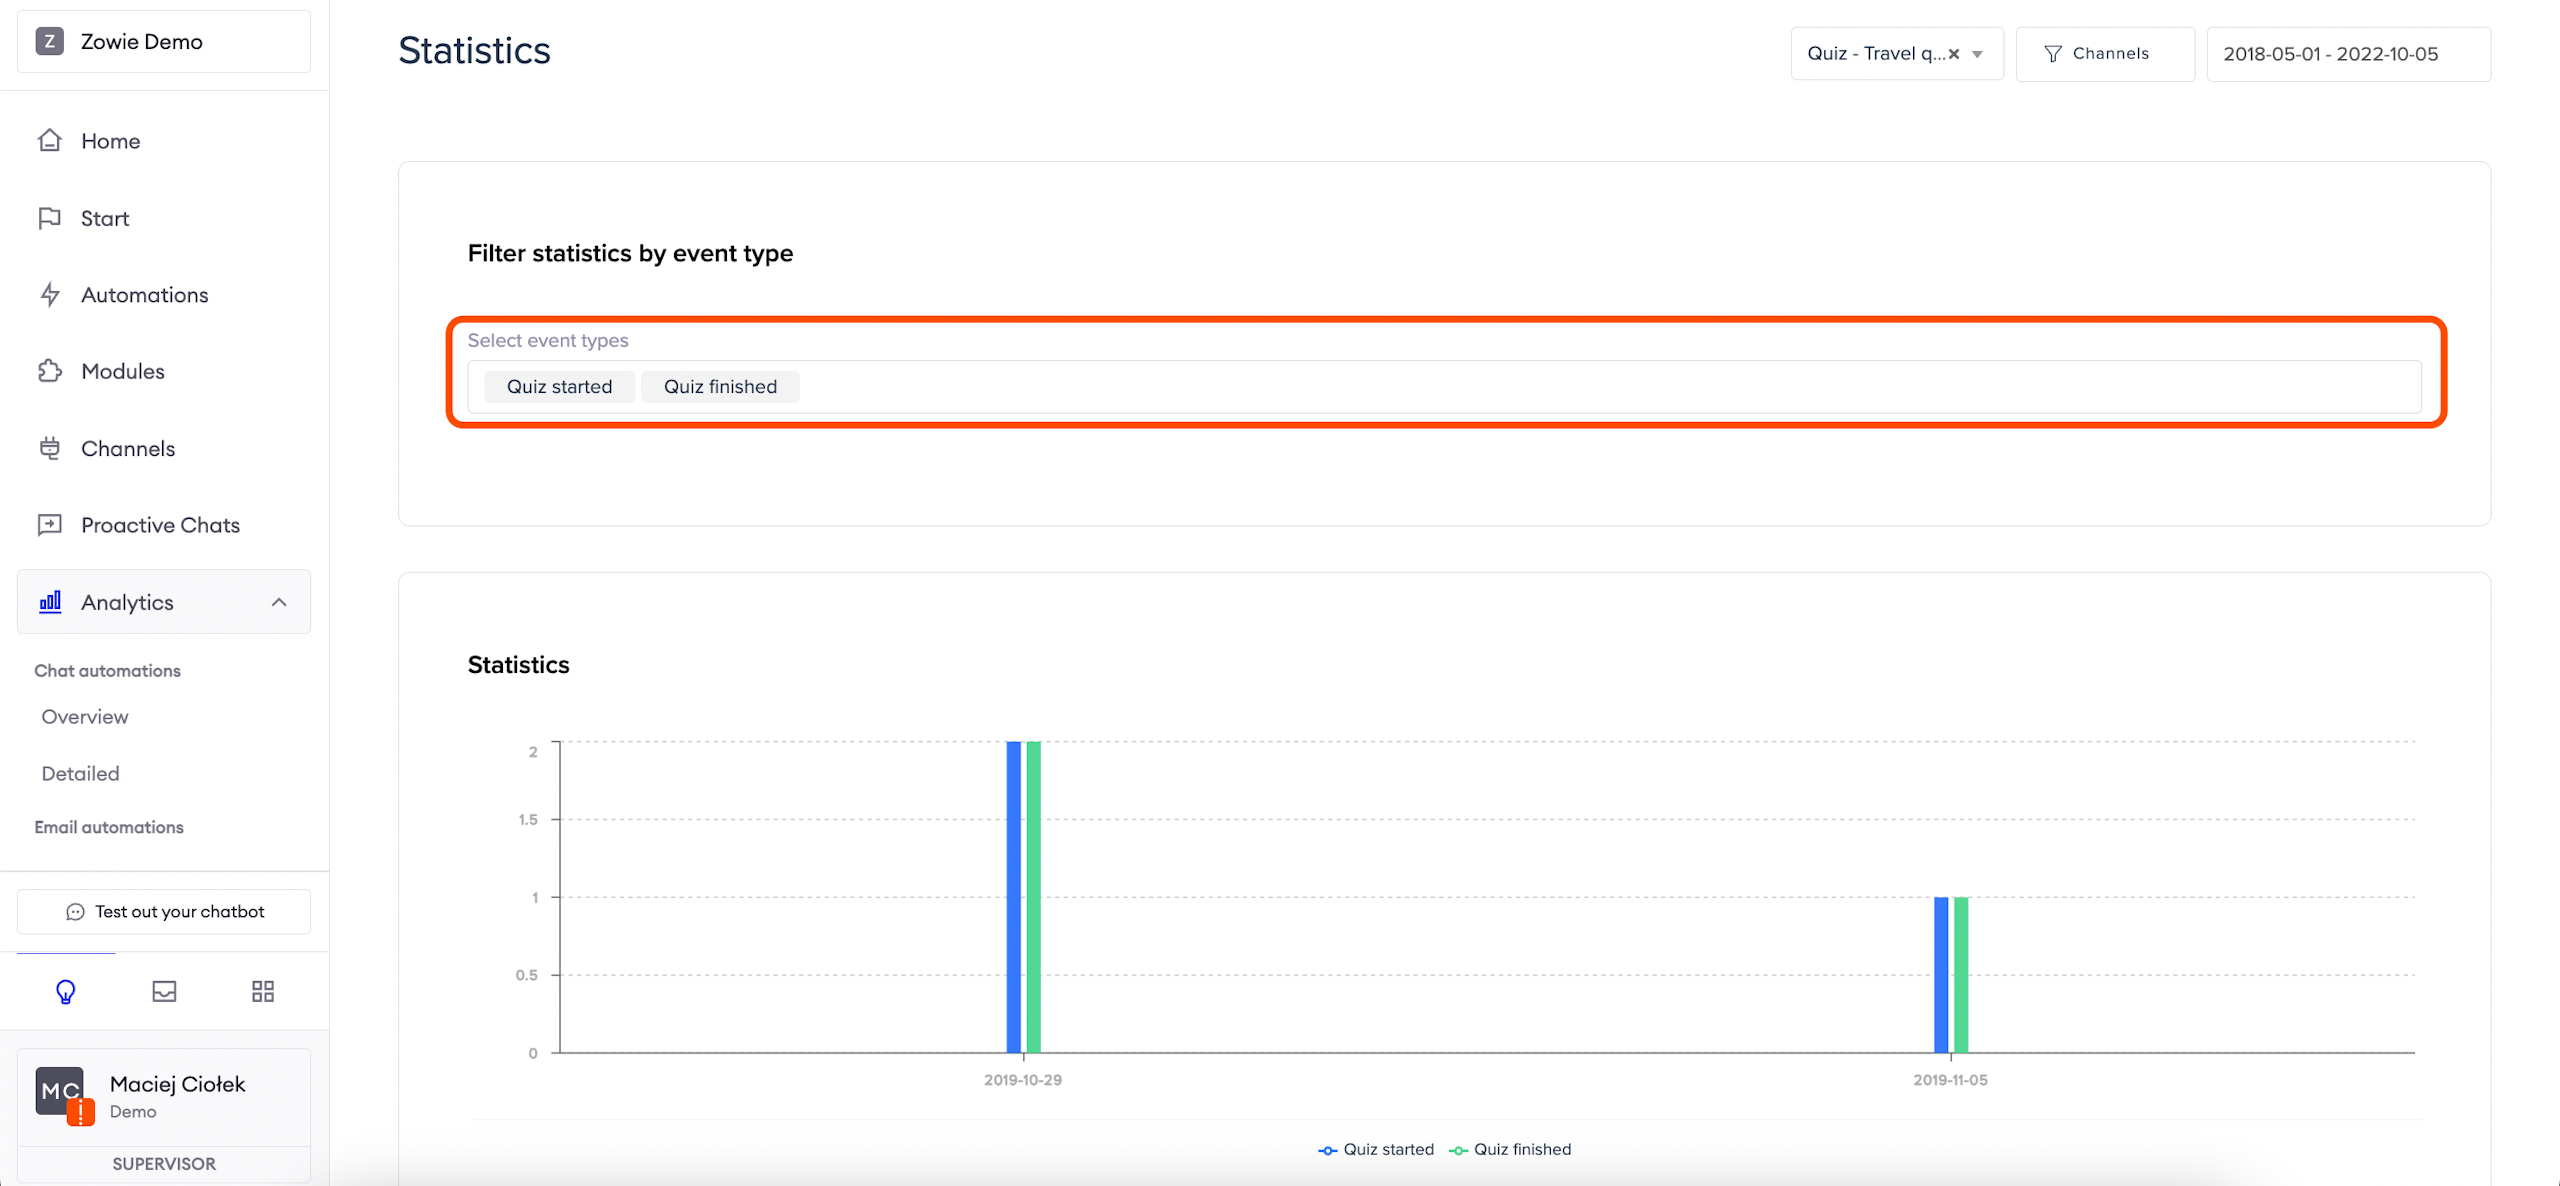
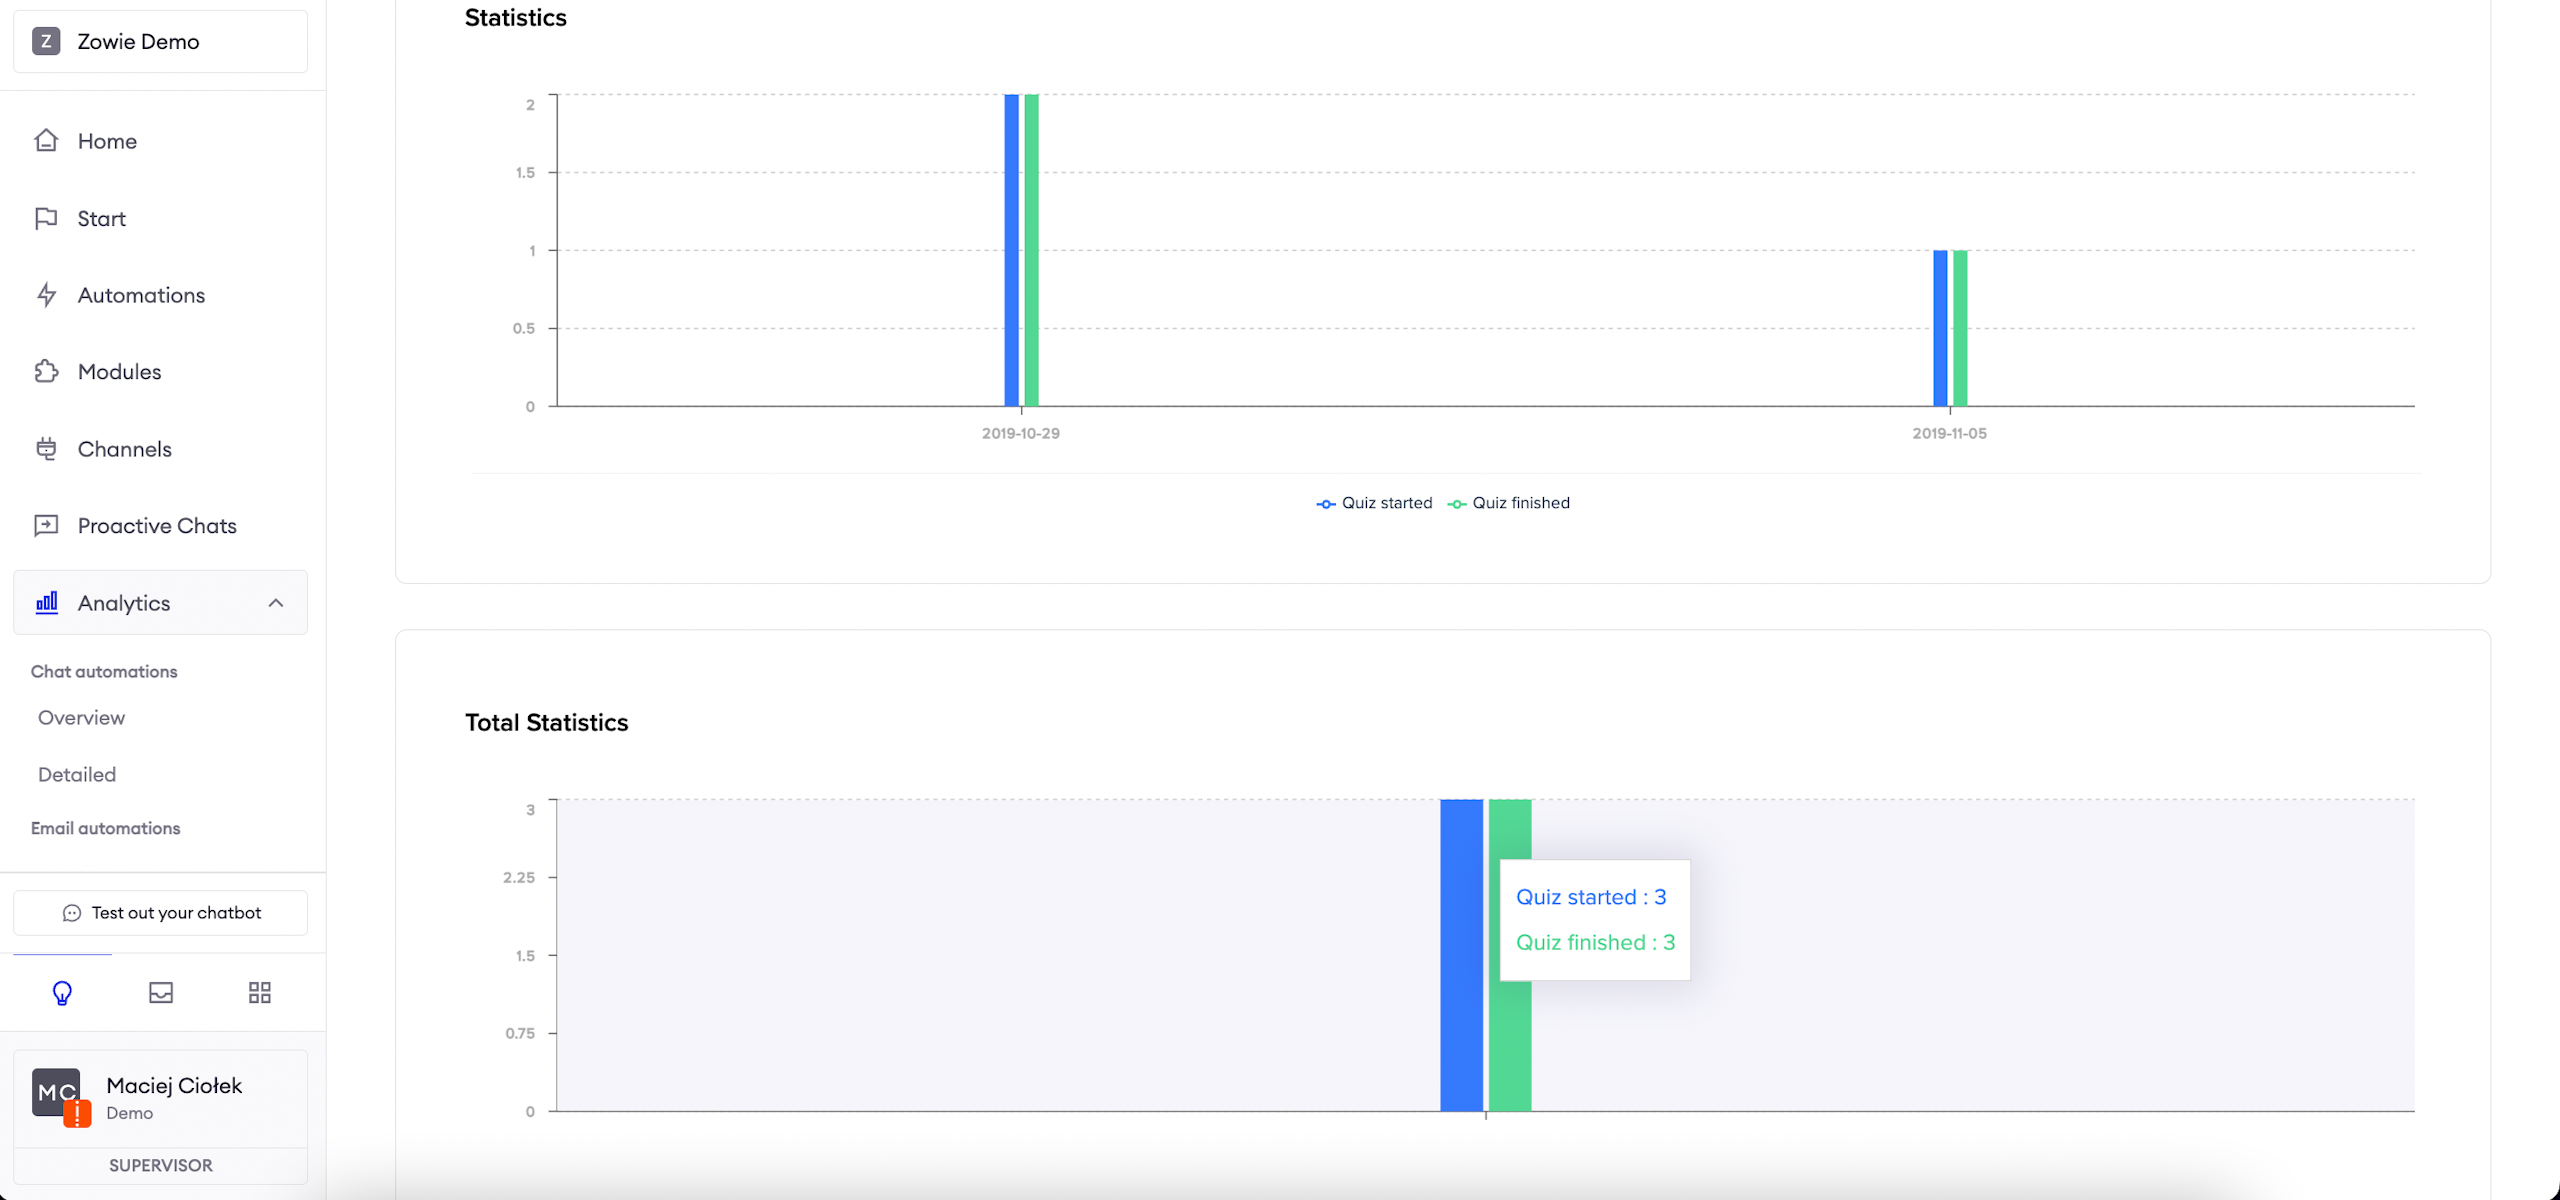
Modules
Most modules expose several events that can later be filtered in the analytics view. Select the module for which you would like to see the statistics in the top right corner and select the event types.
It is possible to filter the results not only by modules but also by source (e.g. Facebook, Instagram) and date.
When filters are chosen, picking indicators from the list is required (e.g. Quiz started, Quiz Finished). Indicators can differ between modules.
Statistics are displayed in two types of charts. In the first one data is broken down by days and in the second one data related to the chosen indicator is summed up (if applicable).
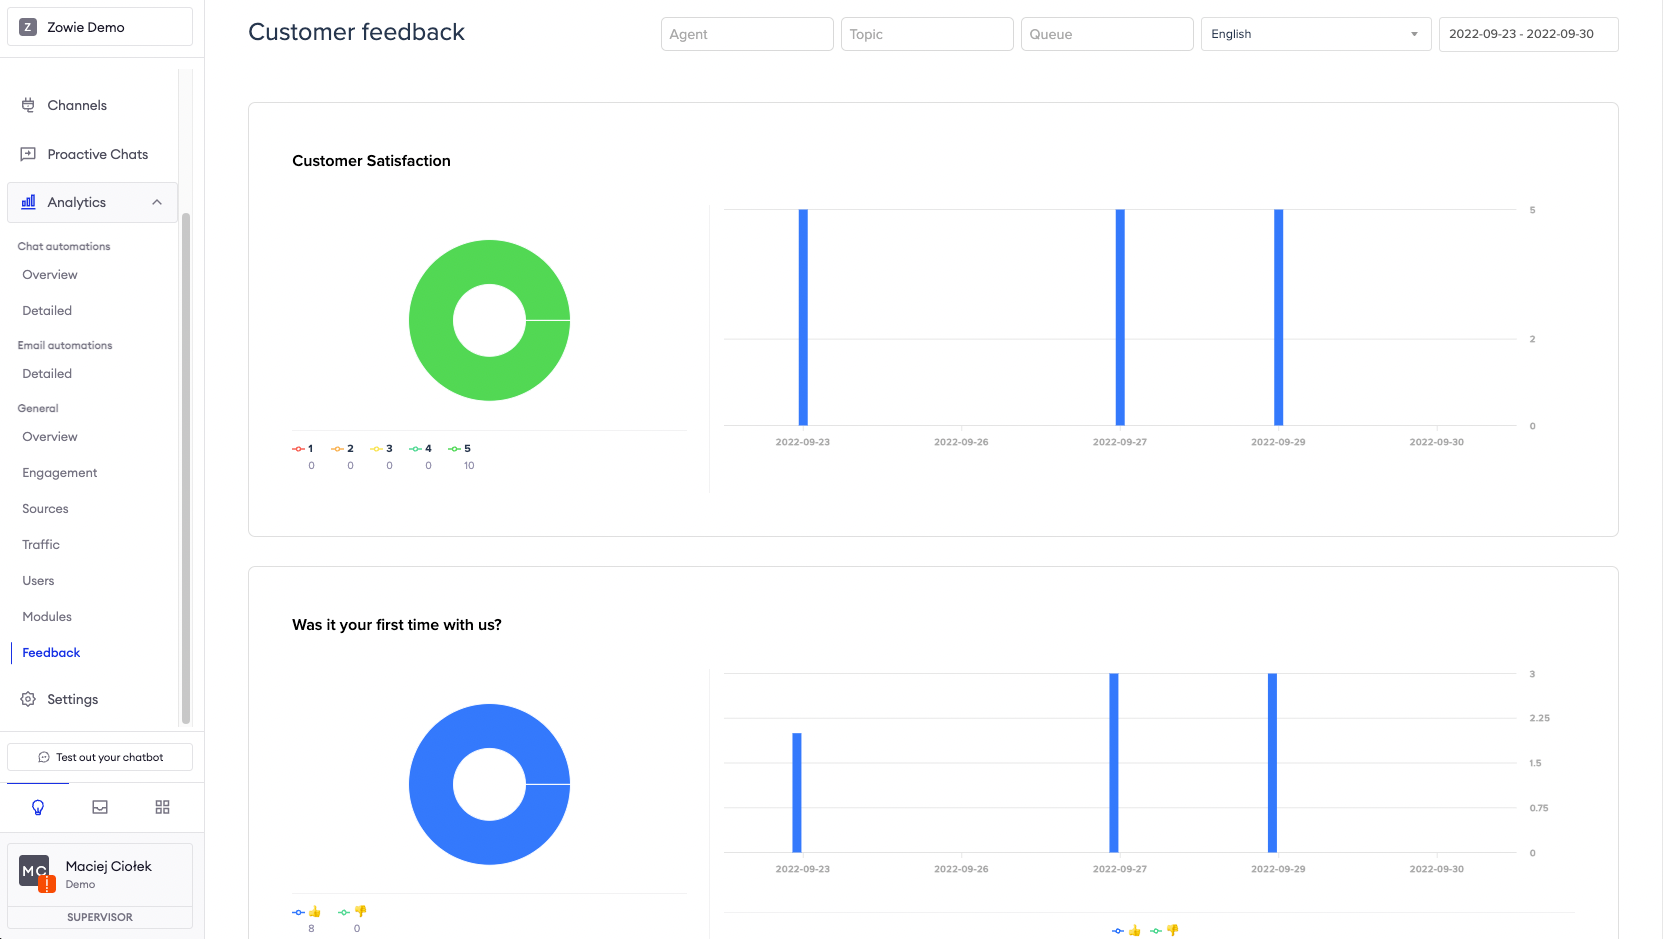
Feedback
The Feedback tab allows you to review feedback about customer service agents, given that the Post Chat Survey is configured and enabled.
Customer Satisfaction is measured by scores given by users to Agents.
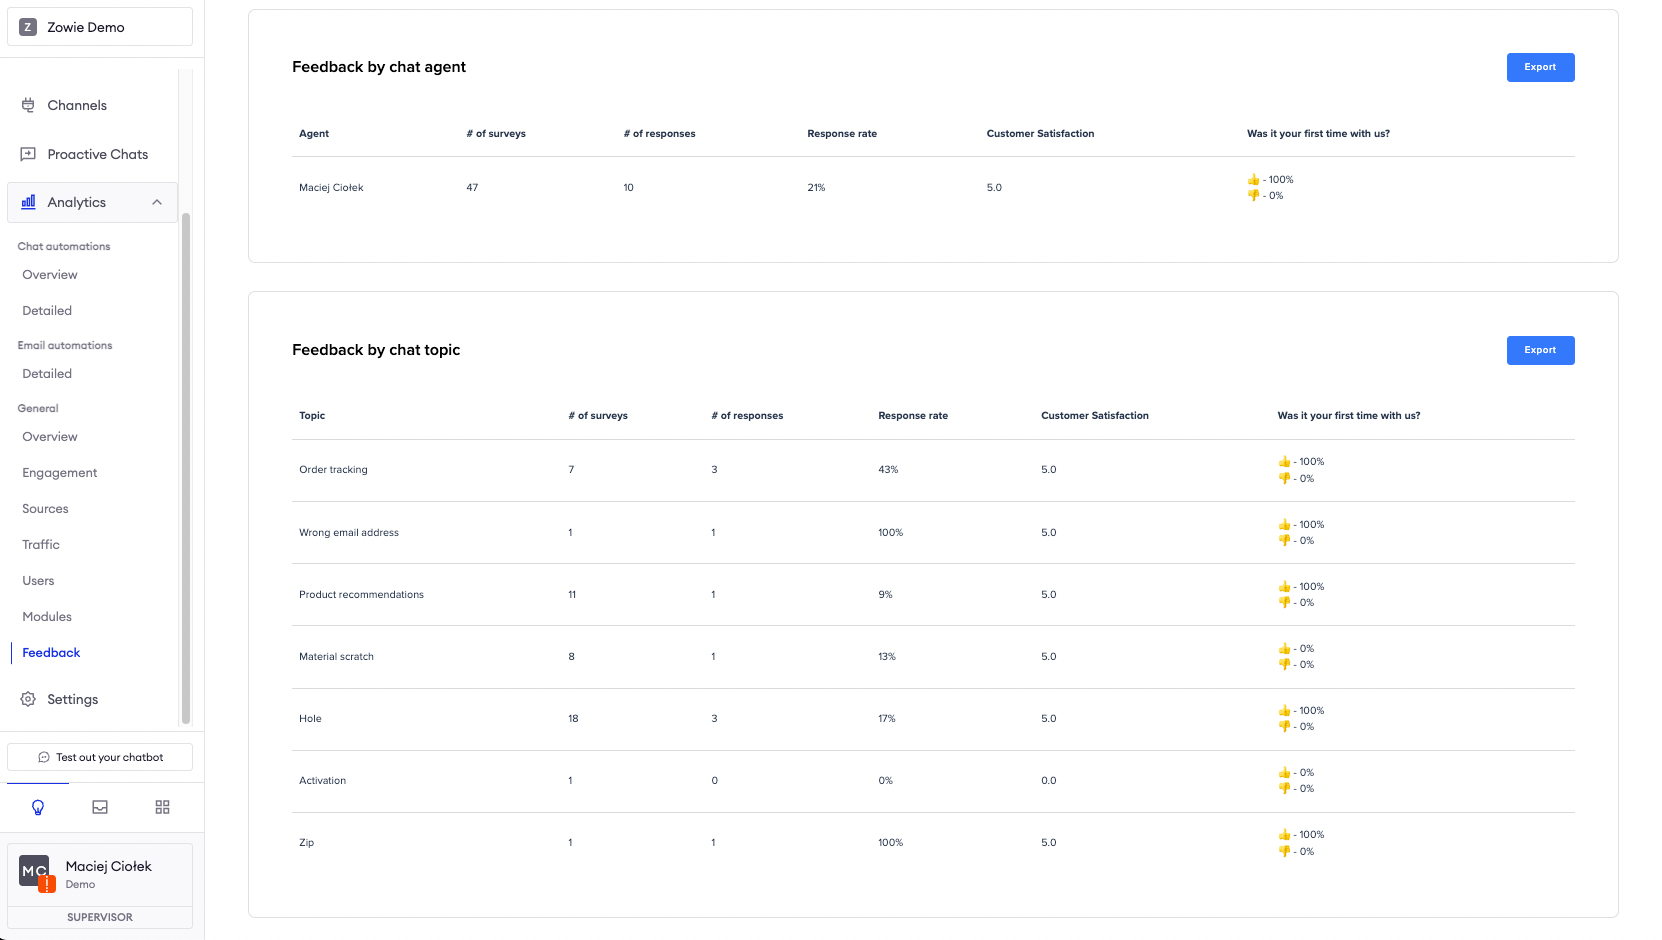
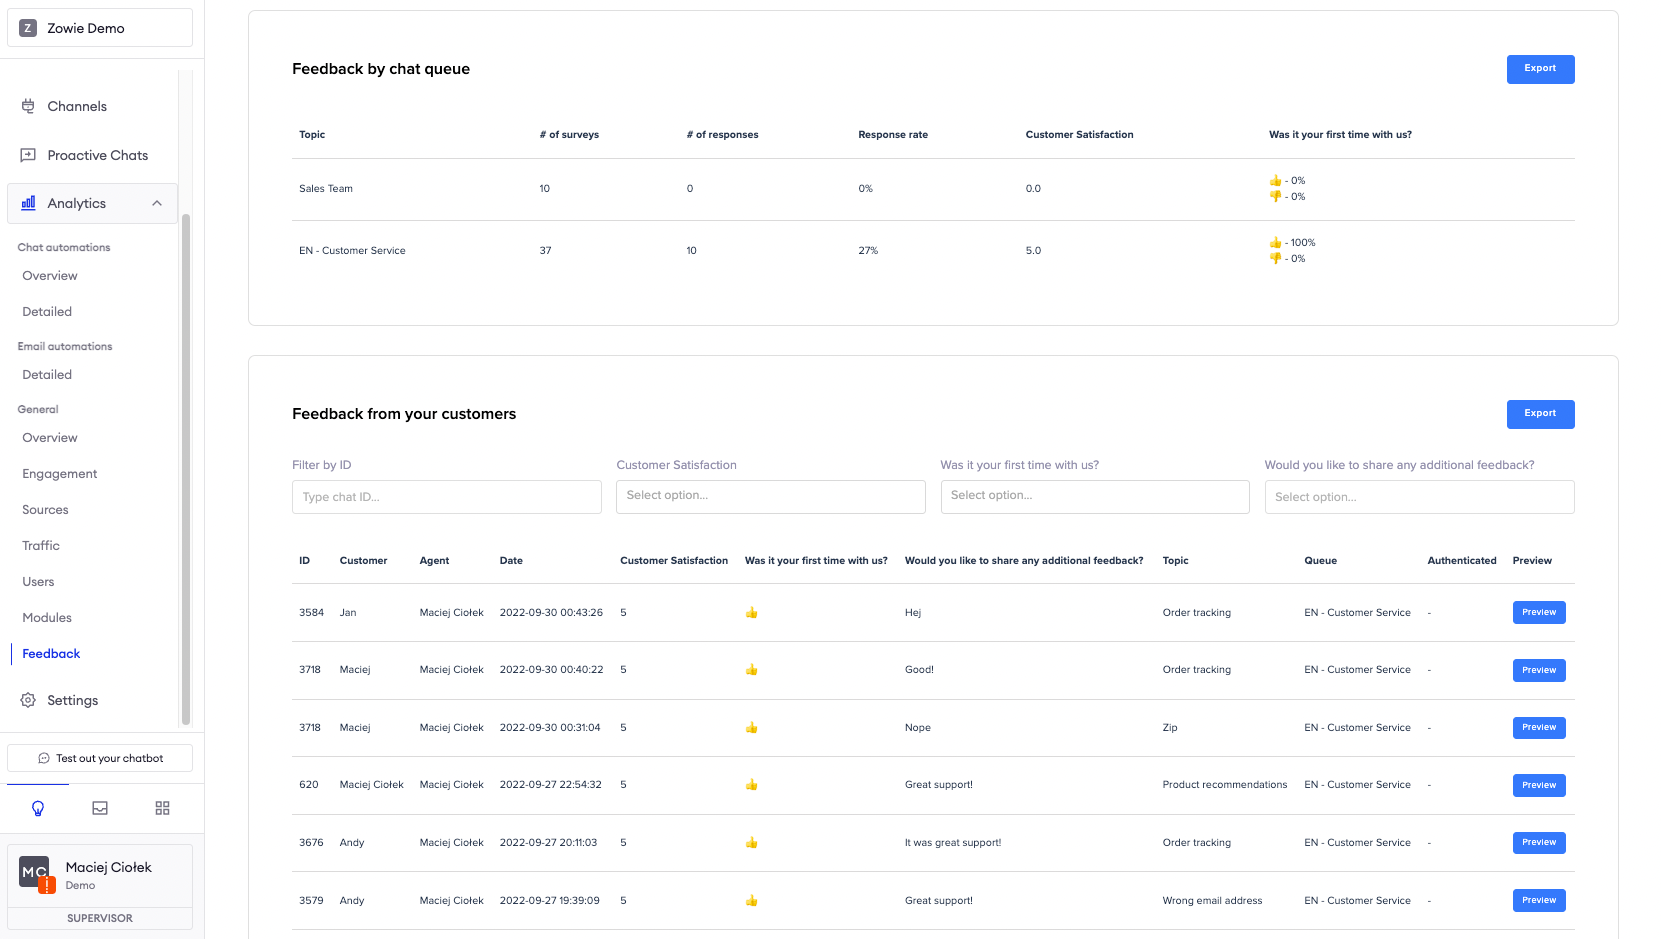
We can also check feedback per agents, topics, queues, and check detailed feedback from the customers.
AttentionThe NPS (Net Promoter Score) is counted in a standarized way by deducting the percent of detractors from the percent of promoters. Replies are assigned to those groups based on their score on the following scale:
0-6 = detractors;
7-8 = passives;
9-10 = promoters.