
Supervisor Dashboard
Supervisor Dashboard consolidates AI Agent performance metrics into a single, holistic view. It combines high-level KPIs, such as Deflection Rate and Transfer Rate - with granular breakdowns by Intent, Knowledge Base articles, Processes, and Contact Reasons. This dashboard provides the insights needed to assess AI Agent’s effectiveness, identify non-performing processes, and support reporting
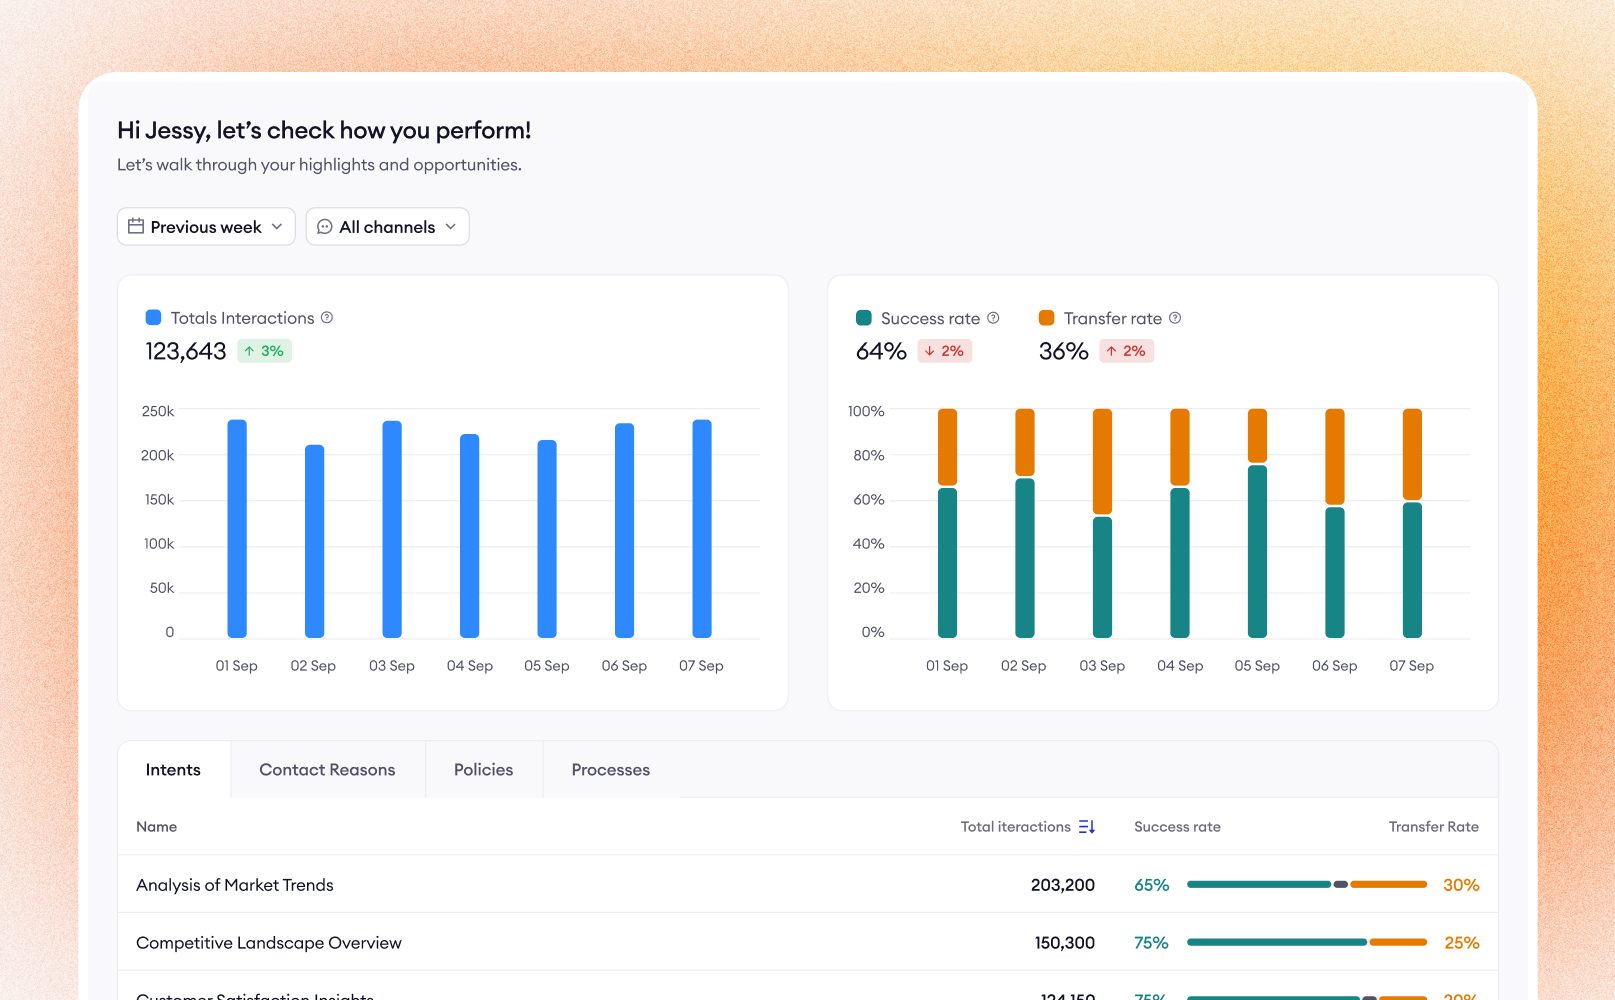
Key information
- Holistic analytics – View metrics for all interactions across every channel (Chat, Email, Phone) in a single unified view
- Time-based comparison – Automatically compares your selected date range with the previous equivalent period to highlight growth or decline
- Deflection vs. Transfer visibility – Instantly see how many interactions are being resolved by the AI versus those requiring human intervention
- Granular breakdowns – Drill down into performance by specific Intents, Processes, Knowledge Base articles, or Contact Reasons
Time Period Selection
Date picker allows to define the specific timeframe for analysis. All metrics, charts, and breakdown tables will automatically update to reflect the selected period
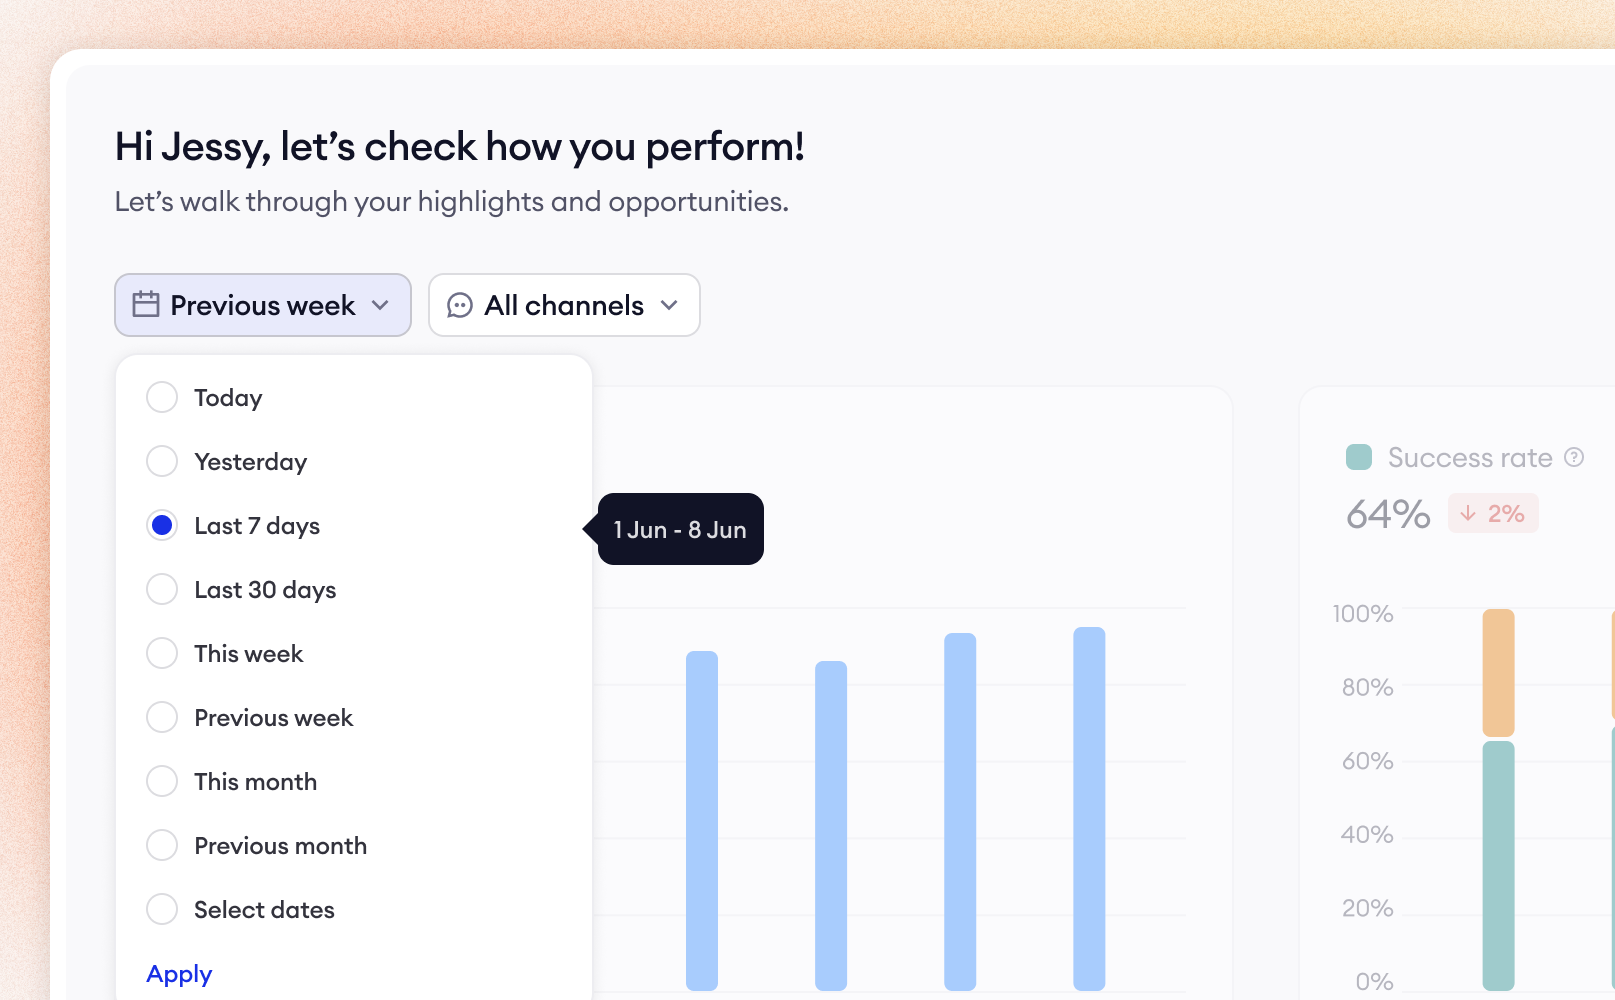
Available presets:
- Today / Yesterday – Quick daily checks
- Last 7 days / Last 30 days – Rolling windows to spot recent trends
- This week / Previous week – Standard calendar week reporting
- This month / Previous month – Monthly performance reviews
- Select dates – Choose a custom start and end date for specific campaigns or deep dives
Comparison Logic: Once you click Apply, the dashboard updates. Remember that all "Delta" indicators (the percentage changes shown in metrics) will automatically compare your selected range to the previous period of the same length.
- Example: If you select "Last 7 days," dashboard compares performance against the 7 days prior to that
Channel Filtering
In addition to time-based filtering, Supervisor Dashboard allows you to segment data by communication channel. Using the channel selector, you can update all metrics, charts, and breakdown tables to reflect performance for a specific touchpoint
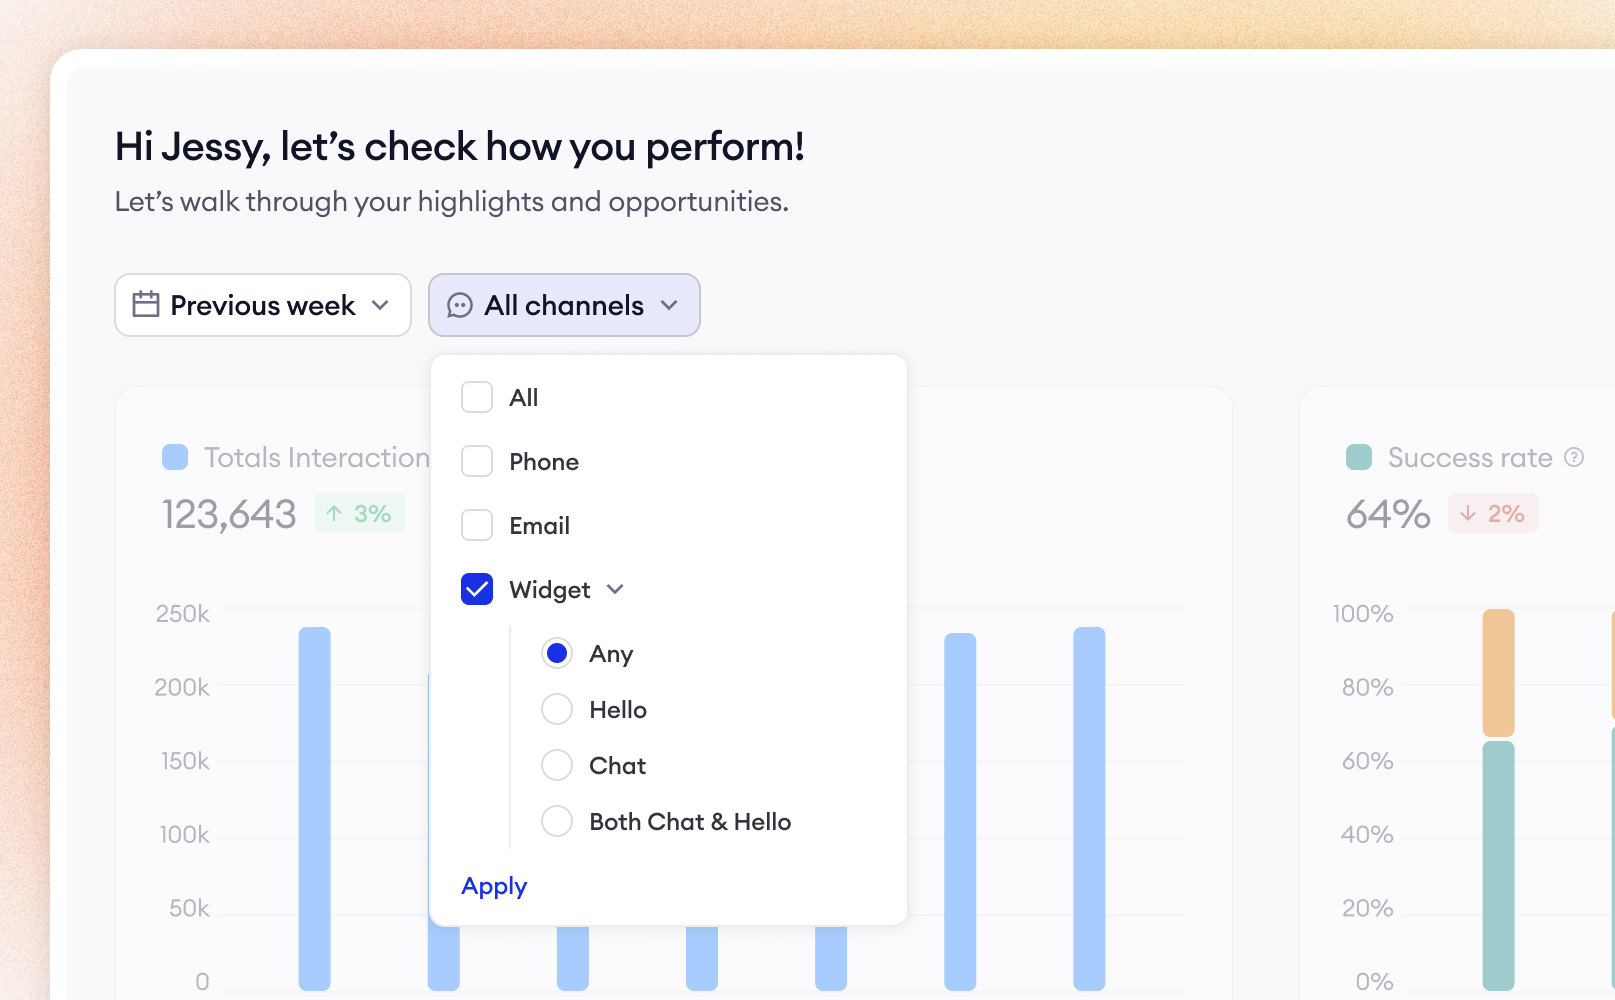
Available channel filters:
- Phone
- Widget: Chat (Displays interactions with Chat and Chat&Hello)
- Widget: Hello (Displays interactions with Hello and Chat&Hello)
- Widget: Chat&Hello (Displays interaction with only Chat&Hello)
Metrics
The dashboard displays three core metrics at the top of the page. All "Delta Indicators" (the percentage changes) compare the currently selected time period to the previous period of equal length (e.g., if you select 7 days, it compares to the previous 7 days)
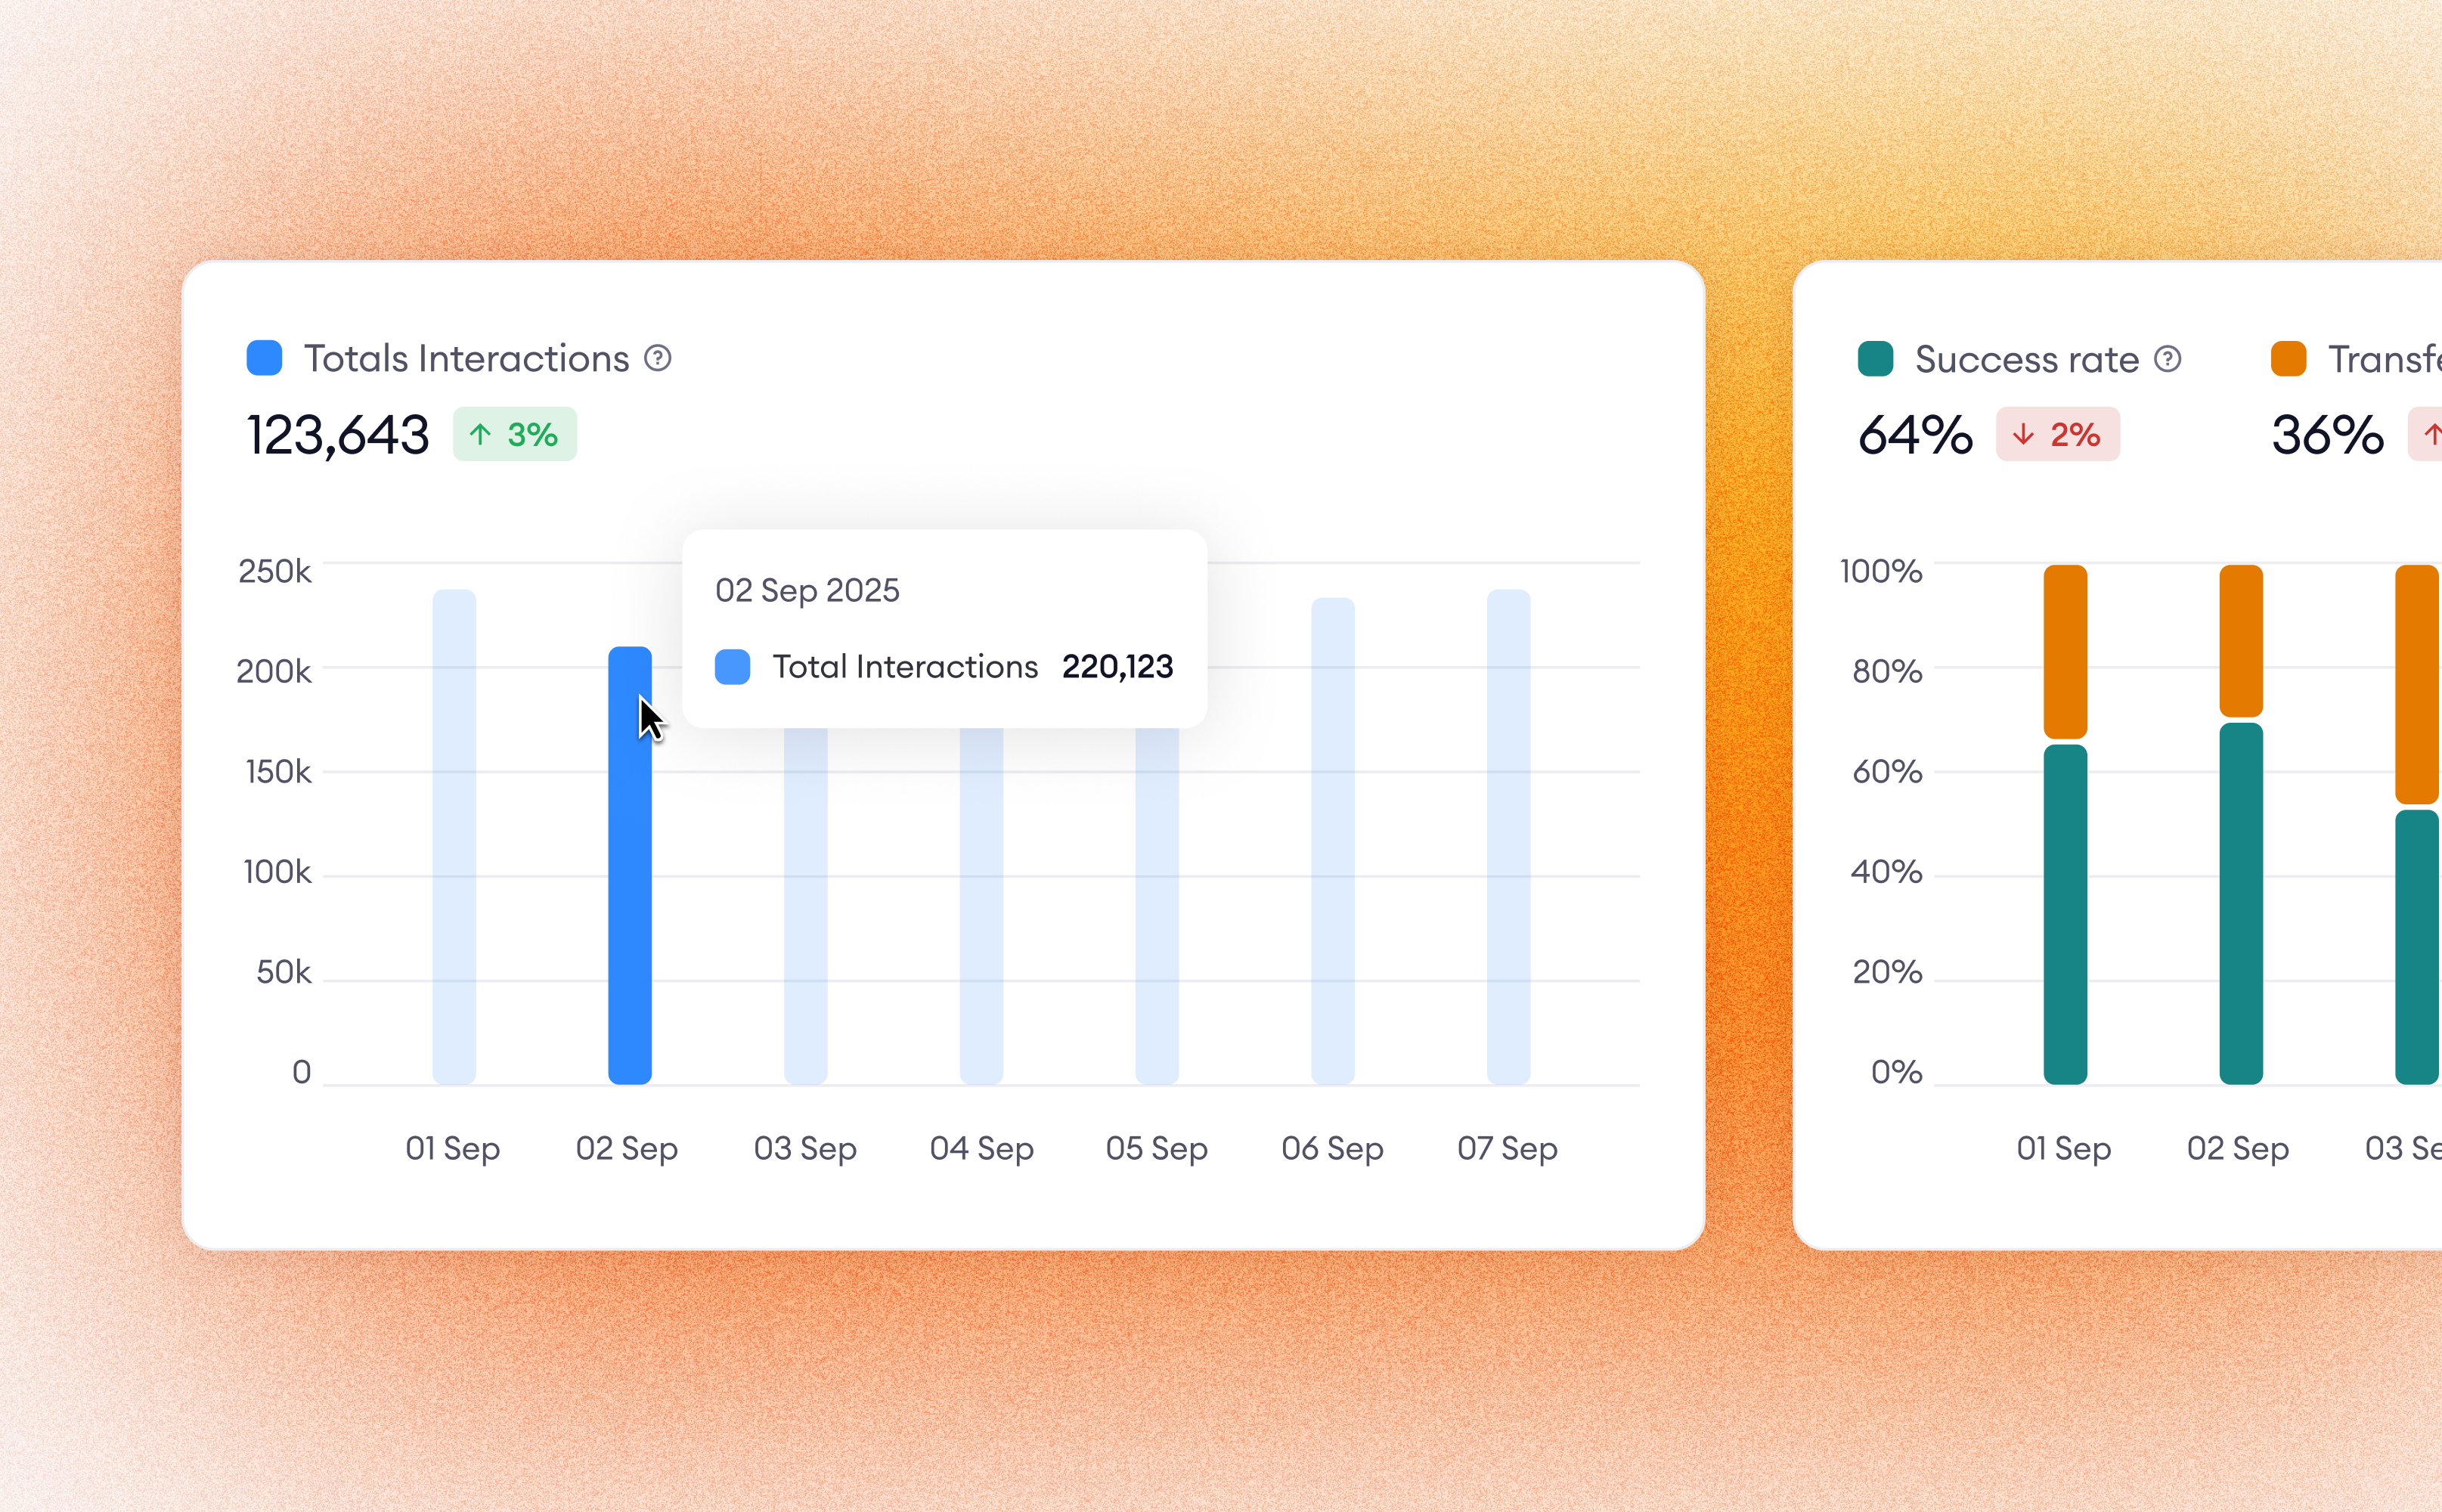
Total Interactions
- Definition: Total number of interactions that occurred across all channels within the selected time period
- Delta Indicator: Shows the percentage increase or decrease in volume compared to the previous period of equal length
- Example: If volume grows from 135,000 to 149,709, the indicator shows ↑10.9%.
- Time Period Comparison: If Nov 3-10 (8 days) is selected, delta compares to Oct 26-Nov 2 (the previous 8 days)
Success Rate
- Definition: The percentage of interactions resolved entirely by the AI Agent without transferring to a human
- Delta Indicator: Shows the percentage point difference. It indicates how the rate itself changed, not the volume of successful chats
- Example: If the rate moves from 30% to 32%, the indicator shows ↑2% (meaning +2 percentage points)
Transfer Rate
- Definition: The percentage of interactions escalated to a human agent
- Delta Indicator: Shows the percentage point difference between the current and previous period's transfer rates (not the change in volume of transferred interactions)
Note: For interactions, specific metrics are connected. Generally, Success Rate + Transfer Rate + Ongoing (active) Rate = 100%
Breakdown Tables
Below the charts, dashboard offers detailed tables with categorized interactions. You can toggle between four views: Intent, Knowledge Base, Process, and Contact Reason
⚠️ How to read Breakdown Table metrics: It is critical to understand that the metrics in these tables refer to the entire interaction that contains selected breakdown item, not just the specific item listed
- Total Interactions Column: The number of interactions where this specific breakdown item (e.g., an Intent or Process) appeared. Note that one interaction can be counted in multiple rows if it triggered multiple processes or intents
- Success Rate Column: The success rate of the entire interaction that included this item
- Example: If the "Cancel subscription" process shows a 40% Success Rate, it means that in 40% of the conversations where "Cancel subscription" was triggered, the user's issue was eventually resolved by the AI (even if the resolution happened later in the chat)
- Transfer Rate Column: The transfer rate of the entire interaction that included this item
Drill Down Functionality
Supervisor Dashboard serves as a starting point for deep-dive analysis. You can click on data points within the Breakdown Tables (Intent, Process, etc.) to instantly navigate to the Supervisor Interaction Table View with pre-applied filters
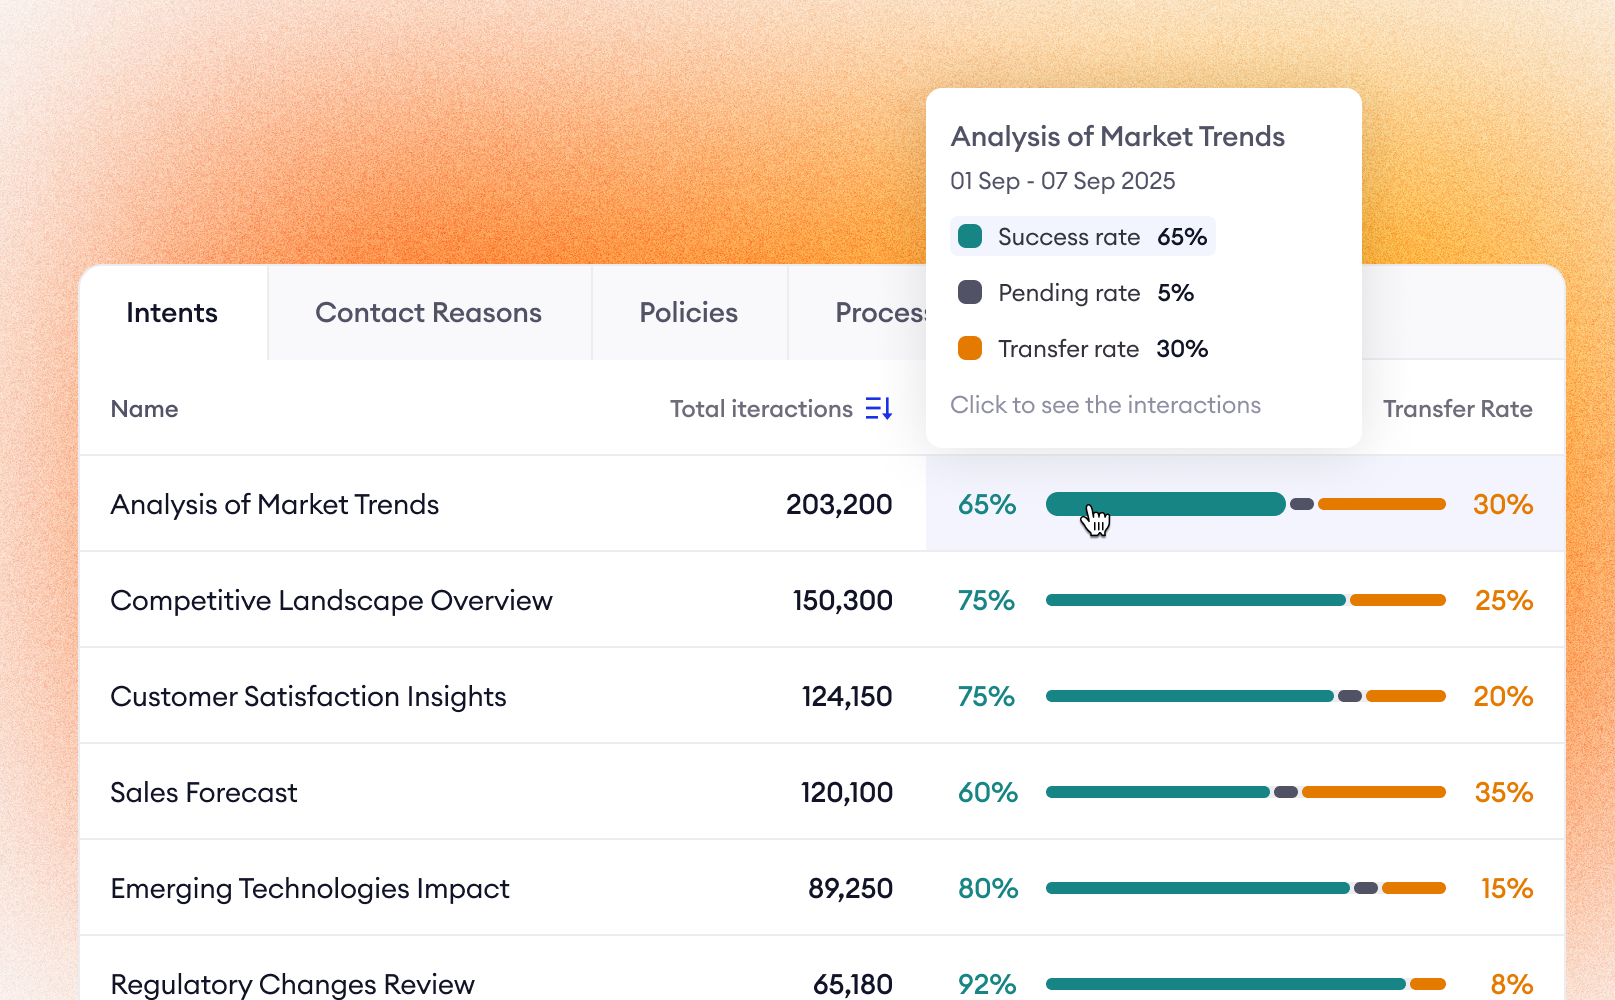
How to drill down:
- Filter by Item: Clicking on the Name of a record (e.g., the specific process "Cancel Subscription") will redirect you to the Interaction List, showing all interactions that included that specific process.
- Filter by Item + Status: Clicking specifically on the Success Rate or Transfer Rate bars/numbers for a row allows for more precise filtering. This applies two filters simultaneously:
- The specific Item (e.g., Process: "Request for transfer")
- The specific Status (e.g., Status: "Transferred")
- Result: You will see only the specific conversations where that process failed and resulted in a transfer
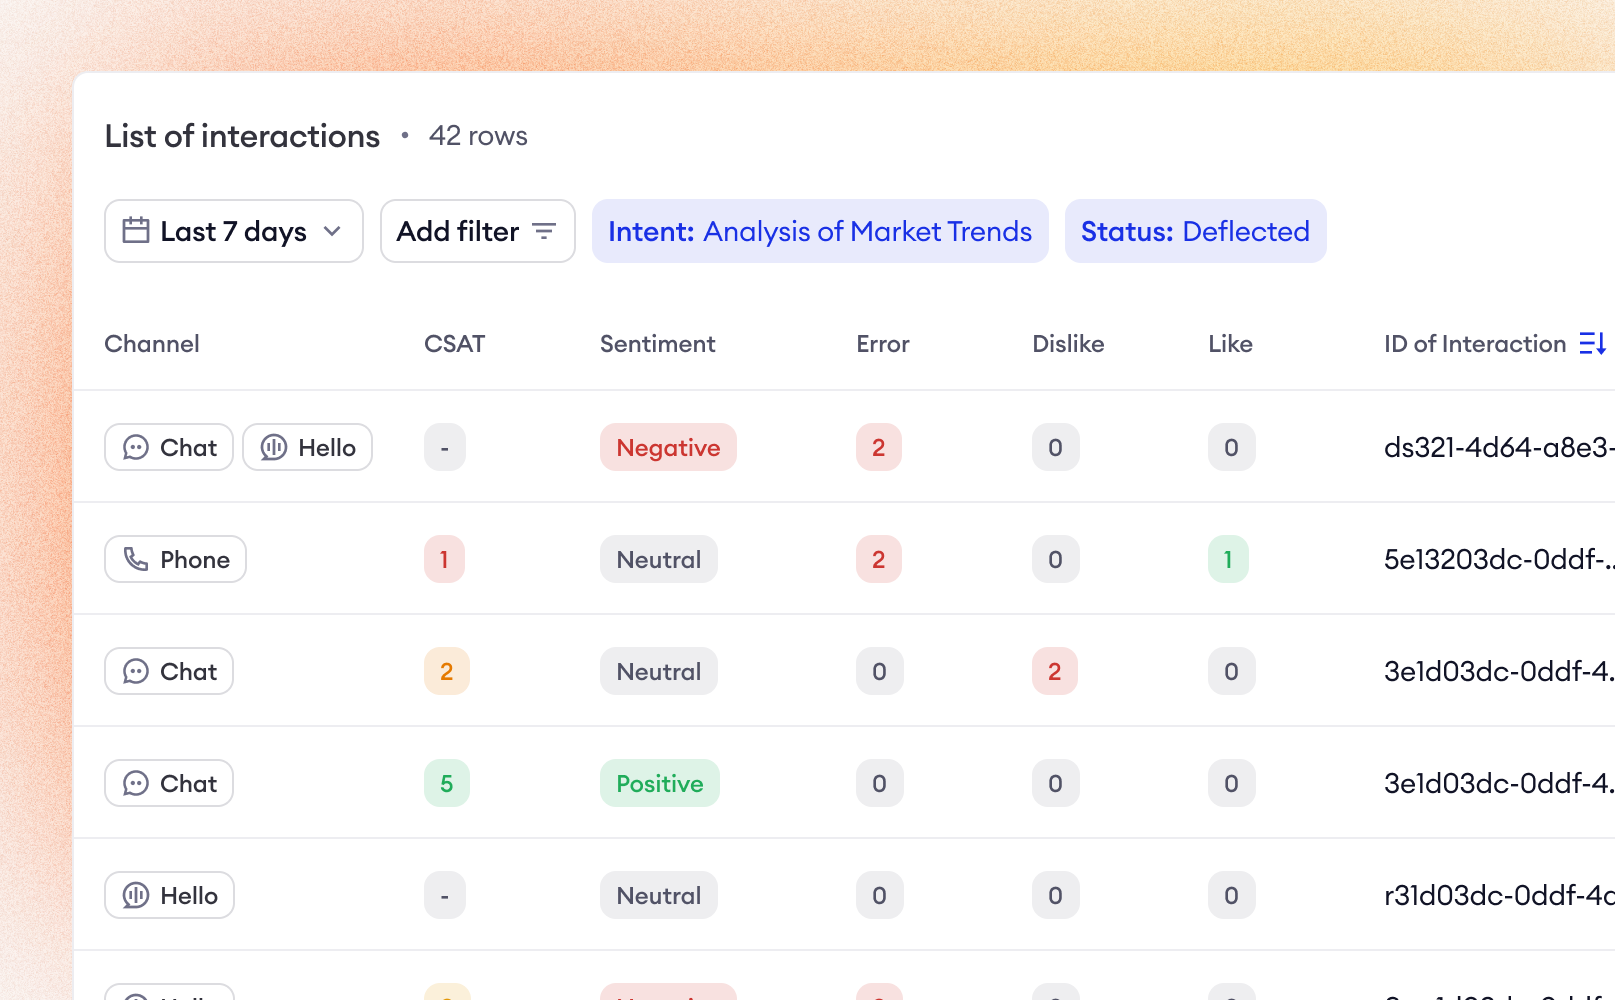
Context Retention
When you drill down from the dashboard, your Date Range selection is carried over automatically. For example, if you are viewing data from "Oct 1 to Dec 1" on the dashboard and drill down into an Intent, the Interaction List will open with the "Oct 1 - Dec 1" time filter already applied, ensuring a seamless transition from high-level analysis to specific transcript review
Using Supervisor Dashboard in practice
The dashboard is designed to help you answer high-level questions before diving into specific transcripts
- Monitor post-launch stability – After launching a new process or intent, check the Total Interactions chart to ensure volume is within expected limits and hasn't spiked due to a configuration error
- Analyze escalation trends – Look at the Transfer Rate chart. If you see a sudden rise in transfers on a specific day, switch to the Breakdown table to identify which Intent or Contact Reason is driving the escalations
- Identify content gaps – Use the Knowledge Base tab to see which articles are referenced in interactions with high Transfer Rates. This may indicate that the article content is unclear or insufficient for the user
- Compare periods – Use the date selector to compare "Last 7 days" vs. the previous week to track weekly improvements in your AI Agent’s Success Rate
Updated 9 months ago