Live Dashboard
What is the Live Dashboard?
The Live Dashboard is a tool built with the needs of customer support managers in mind that shows you the performance of your team in Zowie Inbox at any moment in time.
Why use the Live Dashboard?
The dashboard allows you to gather insights about your agents to improve performance, and can be customized according to your needs. Agents can also find it useful to see their performance. The access to the dashboard will reflect the access level configured in the Profile settings.
How to access the Live Dashboard
Access this page by selecting Live Dashboard under the Inbox navigation bar.
AttentionWe are still in the beta phase and we encourage you to send us feedback regarding future development of this feature.
Available data
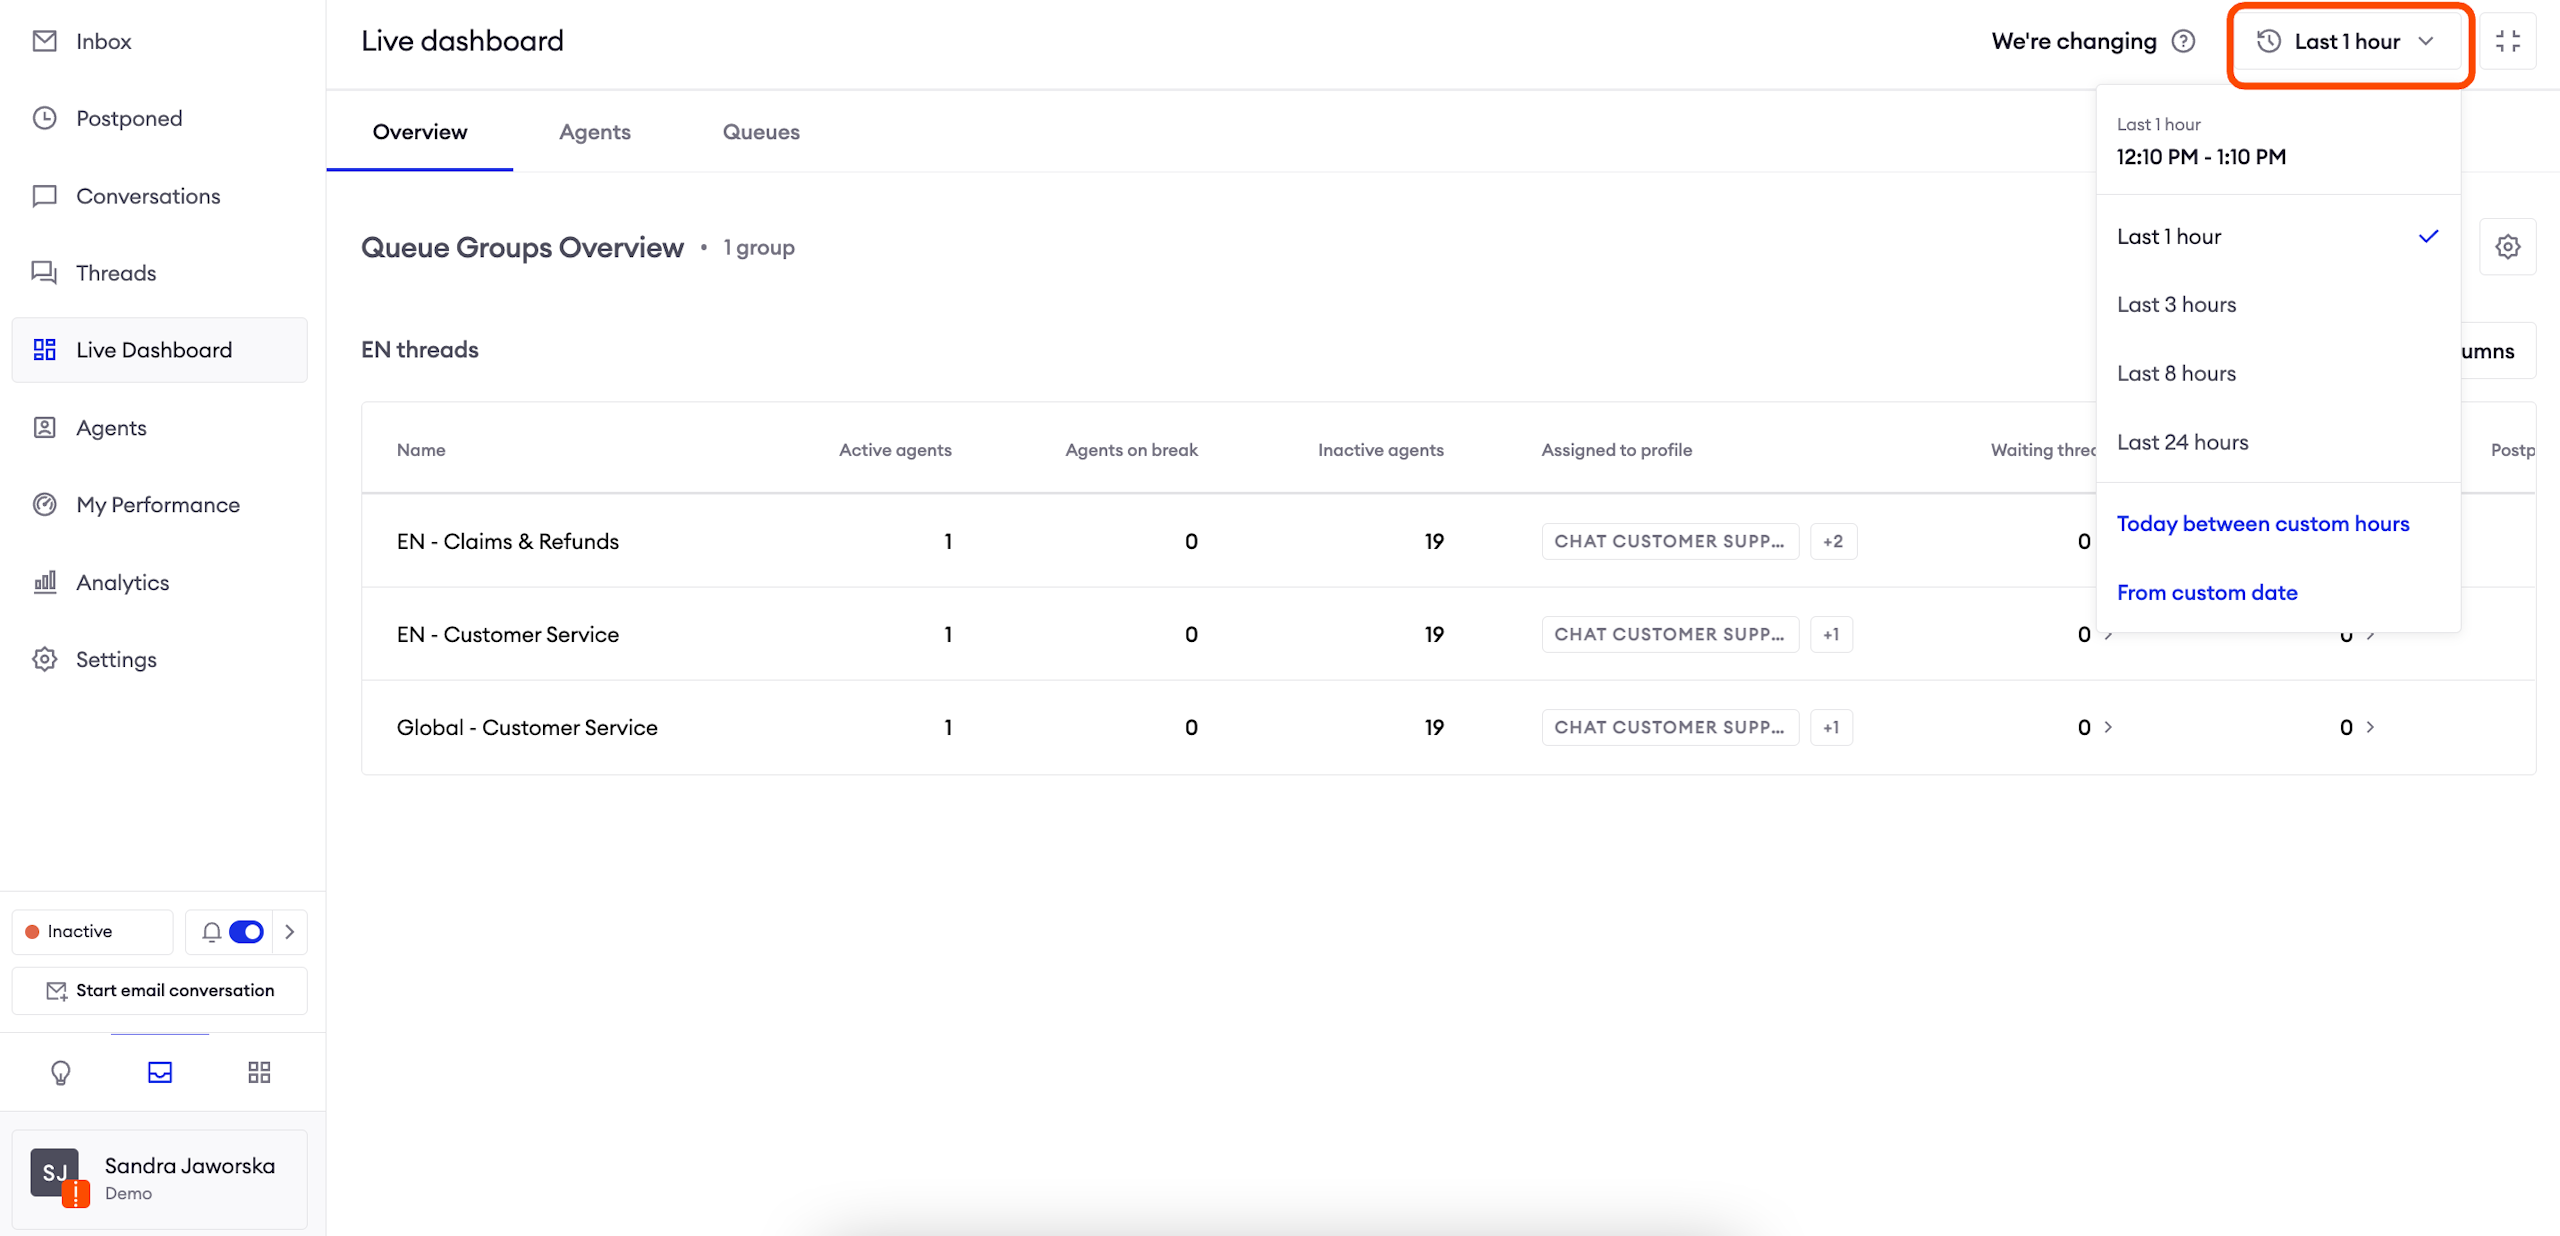
The purpose of the Live Dashboard is to show you the current state of your customer support team. This is why you can select a starting date of the range, and it will always go up to now. You can choose one of the three options:
- A predefined time bracket (last 1 / 3 / 8 / 24 hours);
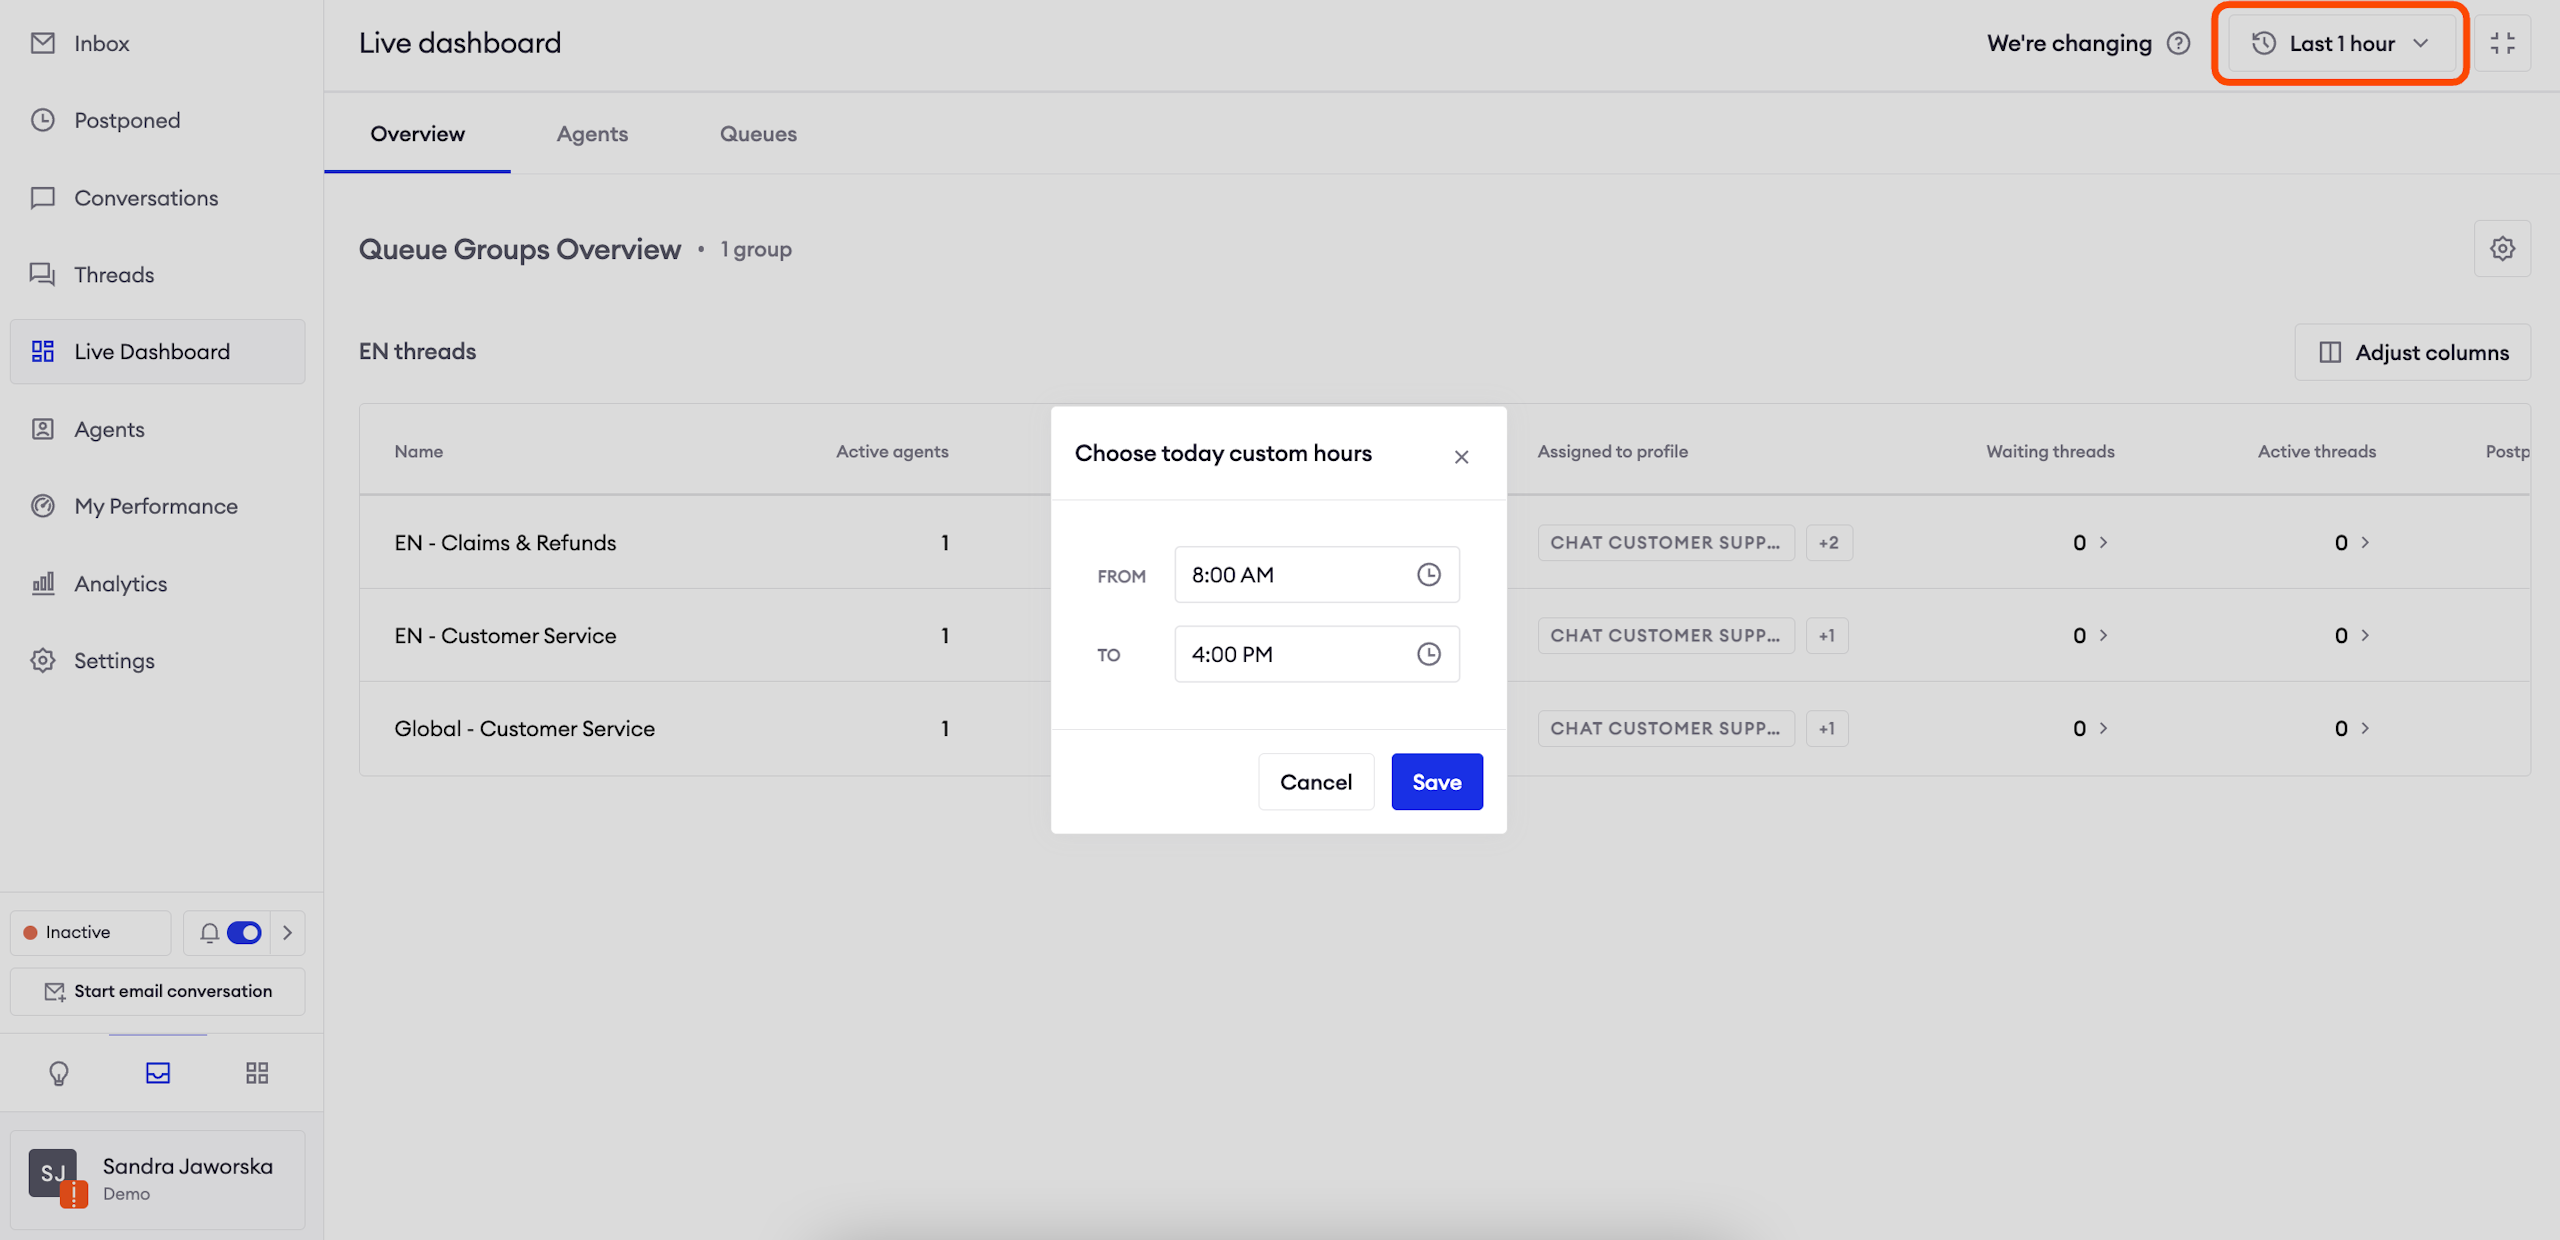
- Today between custom hours: select the hours of interest in the current day;
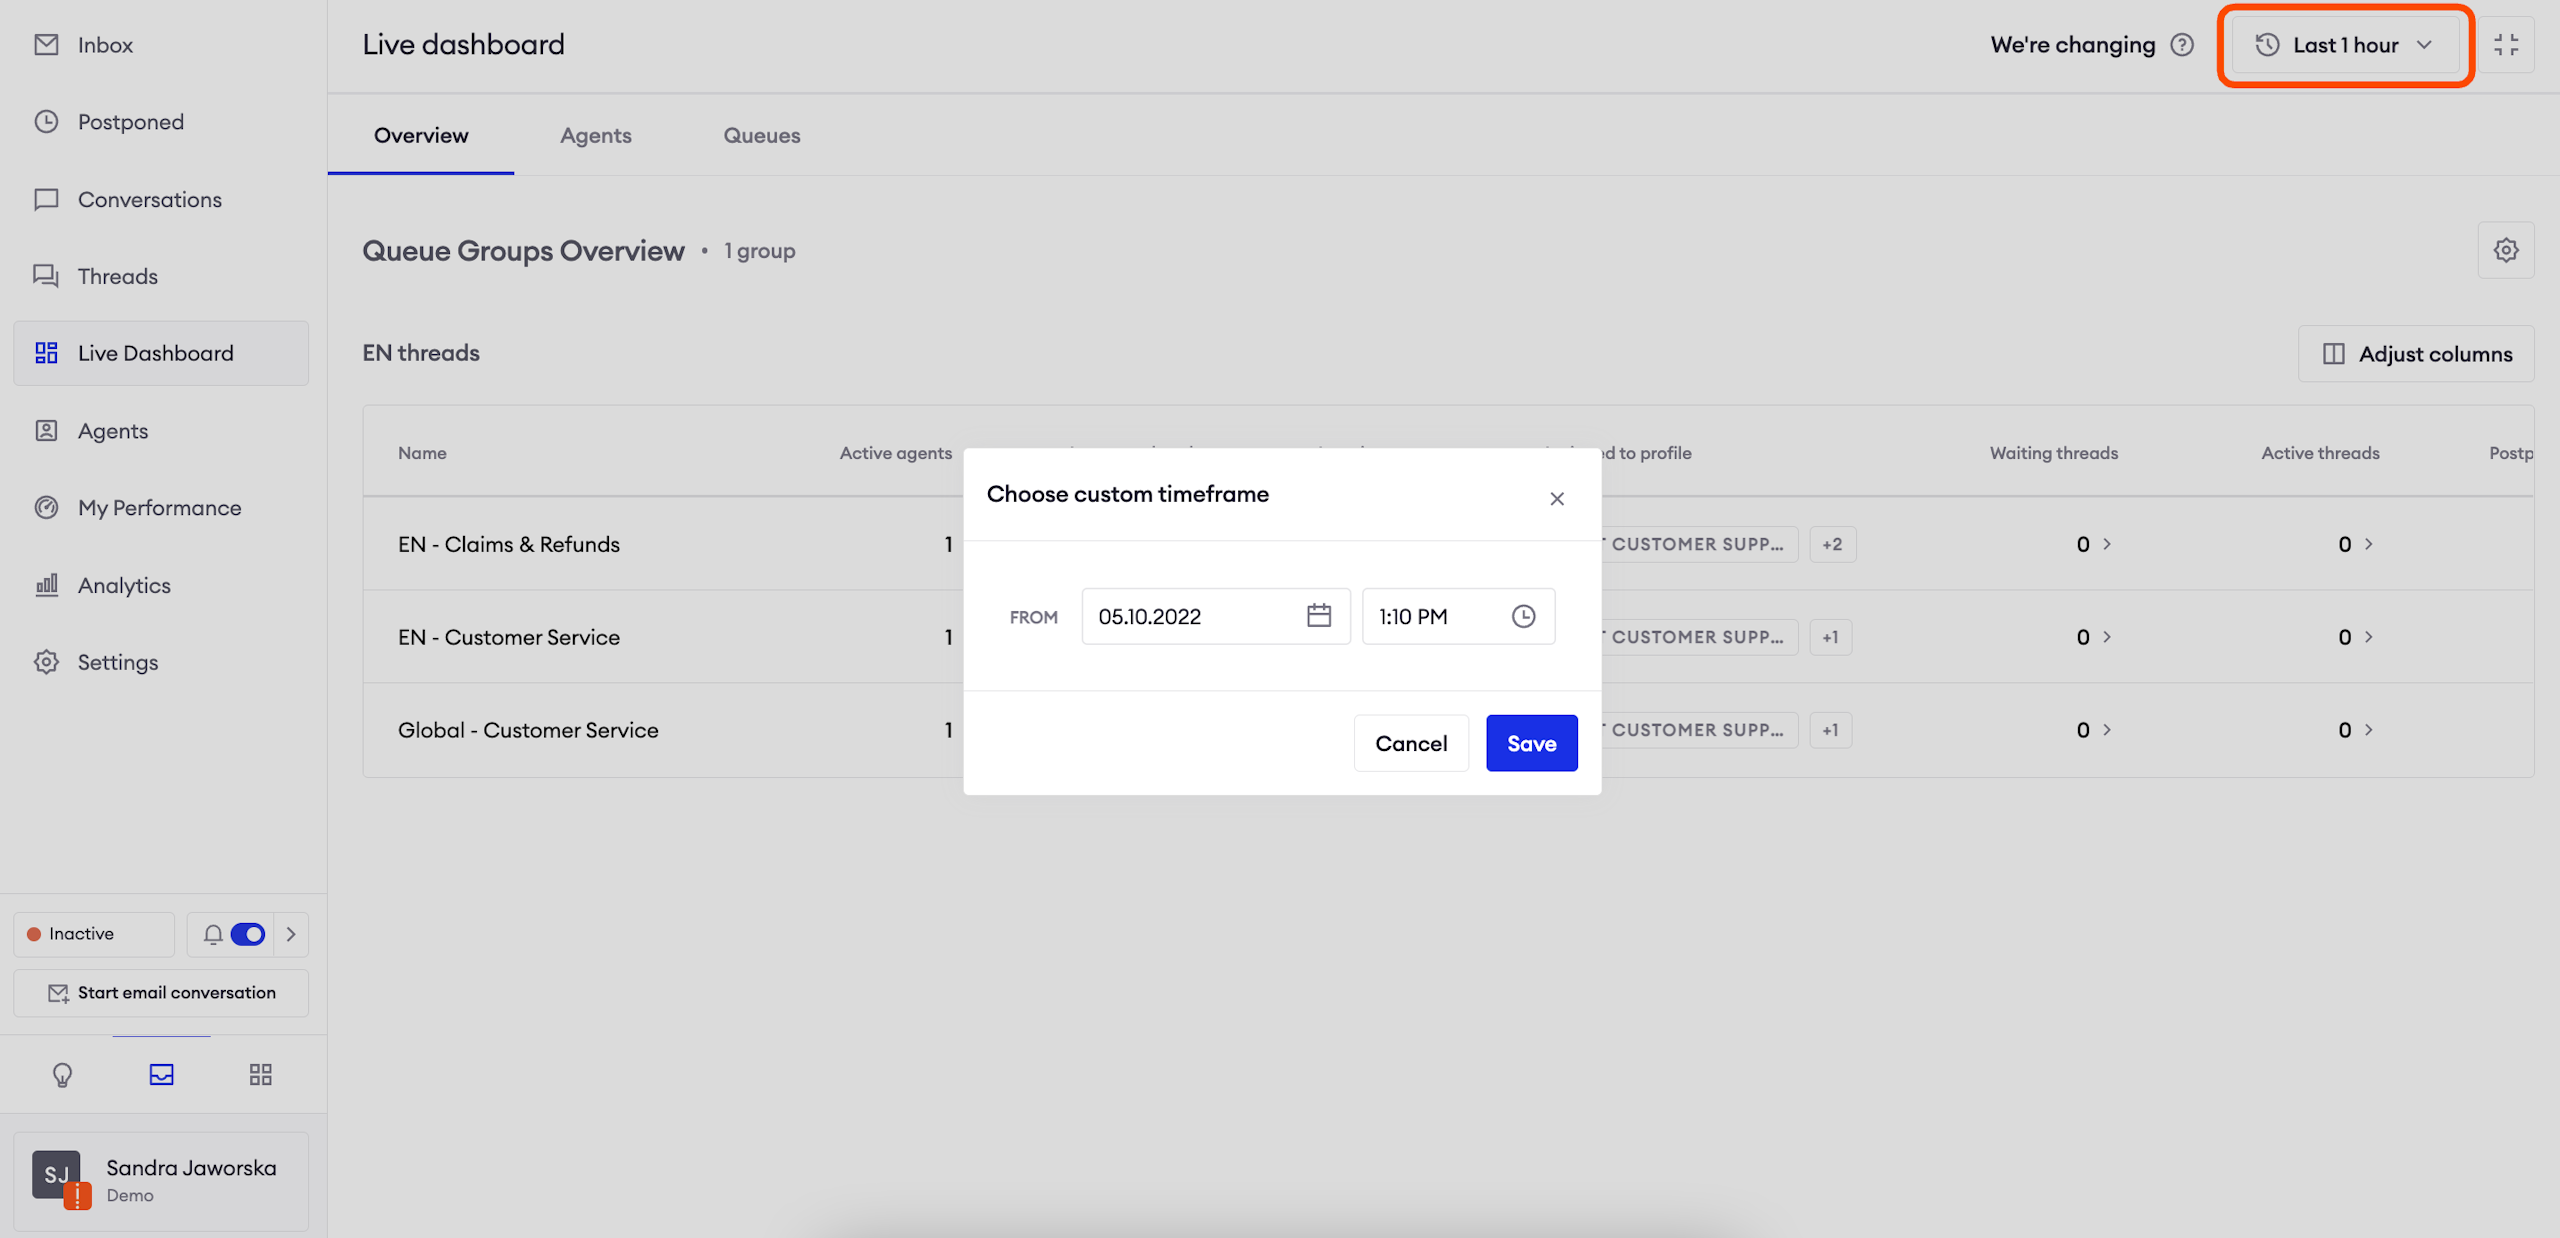
- From custom date: select the starting date of the monitored period.
Data collected before 1.01.2022 is not available in the Live Dashboard.
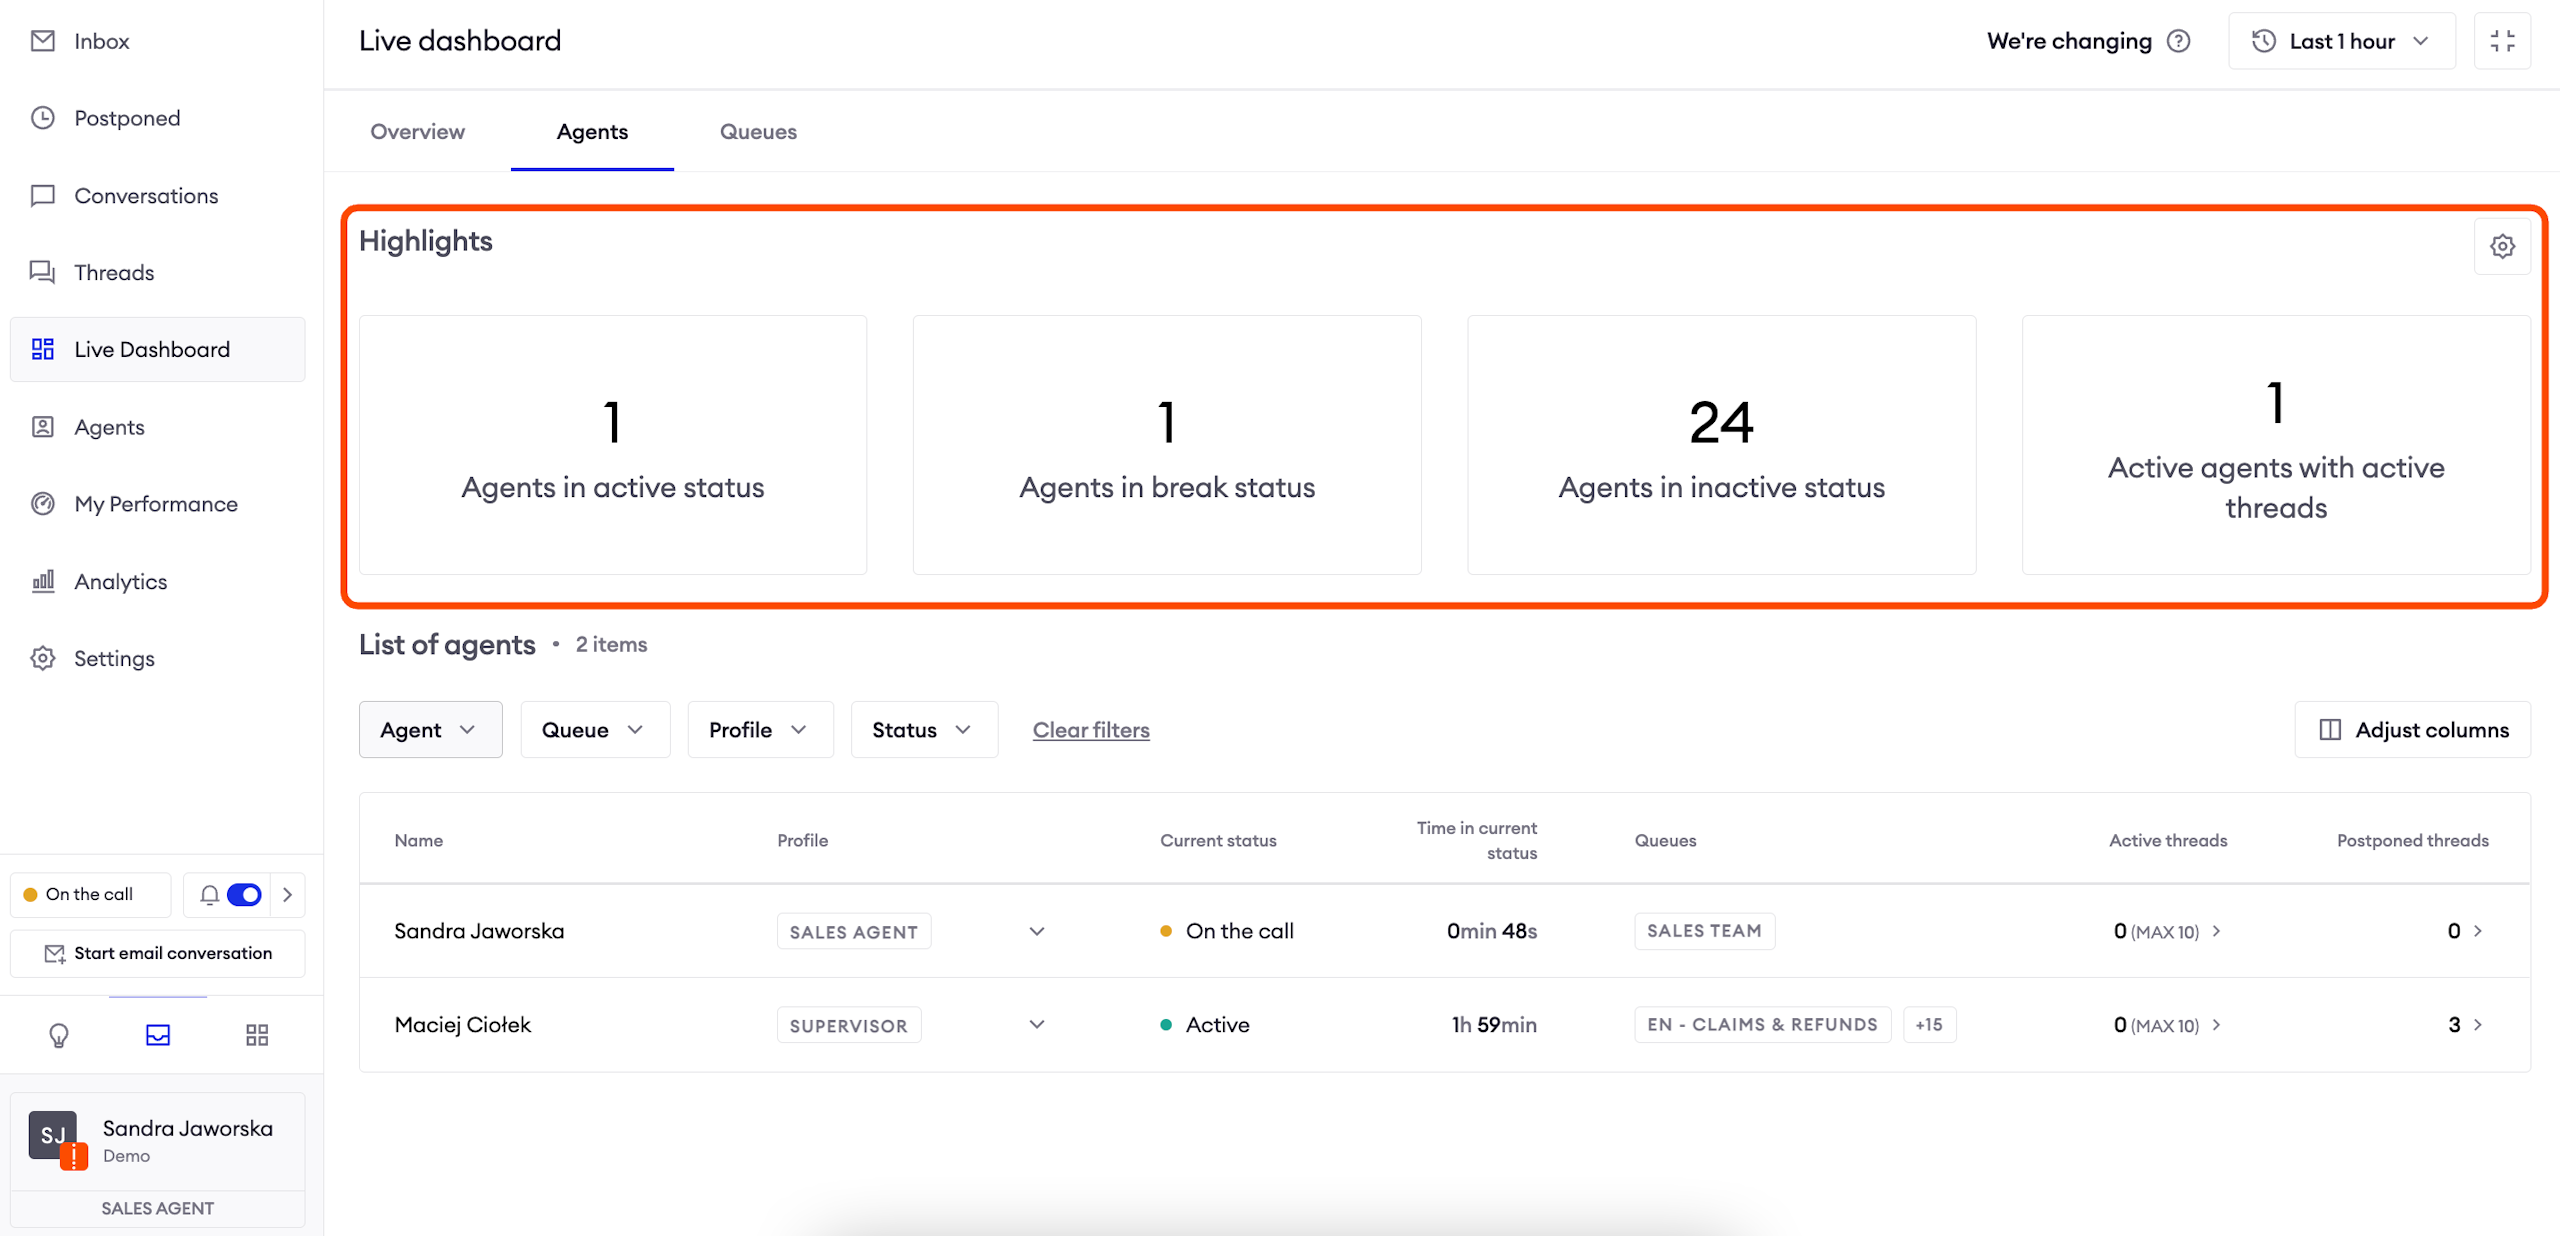
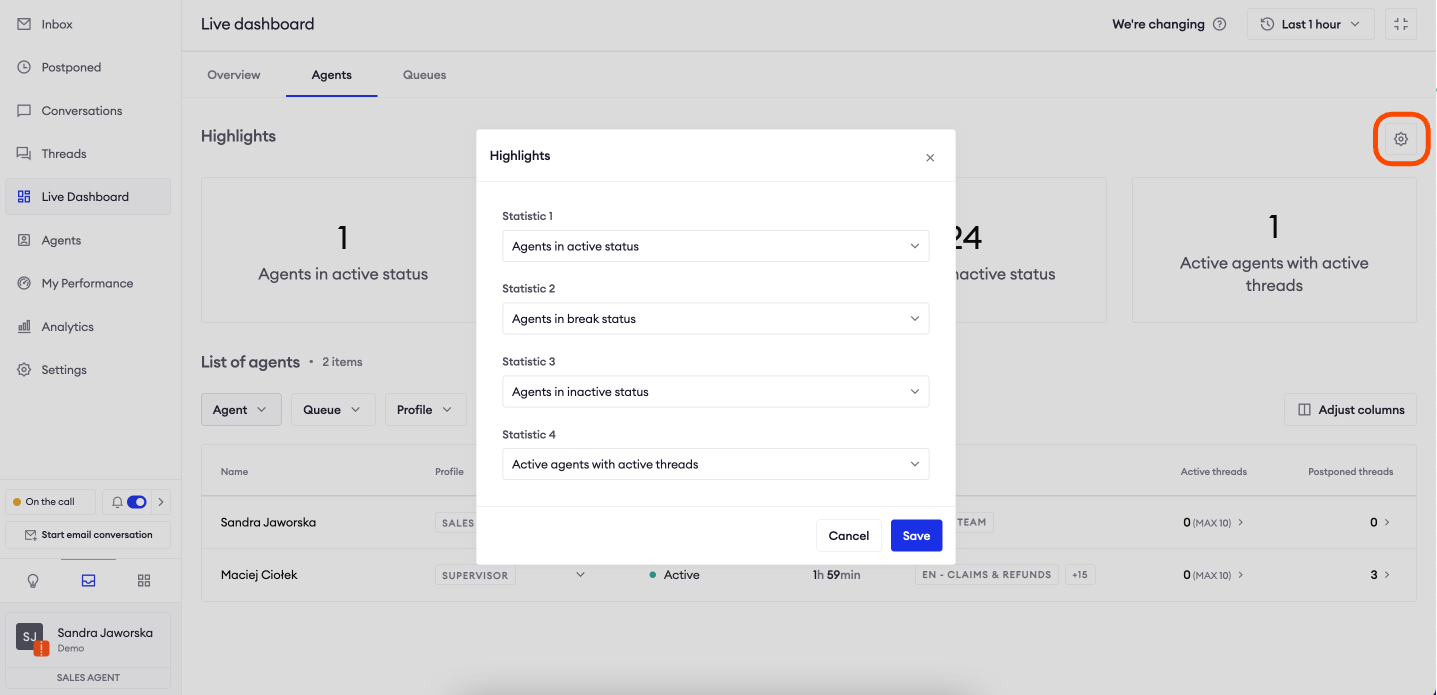
Highlights
This section displays key metrics configured by you. The configuration is sticky, which means that you will see the same metrics in the agents and queues tabs. The following metrics are available:
- Agents in active status;
- Agents in break status;
- Agents in inactive status;
- Active agents with active threads: displays the number of agents with currently assigned threads which were not marked as done (postponed threads are counted towards active threads);
- Active agents without active threads: displays the number of agents without any assigned threads (active or postponed);
- Agents who didn’t meet first response time SLA;
- Agents who didn’t meet next response time SLA;
- Agents who didn’t meet resolution time SLA.
AttentionNote that you need to configure SLA values in the Queues section in order to see corresponding metrics in the highlights since the metrics take into account current SLA values.
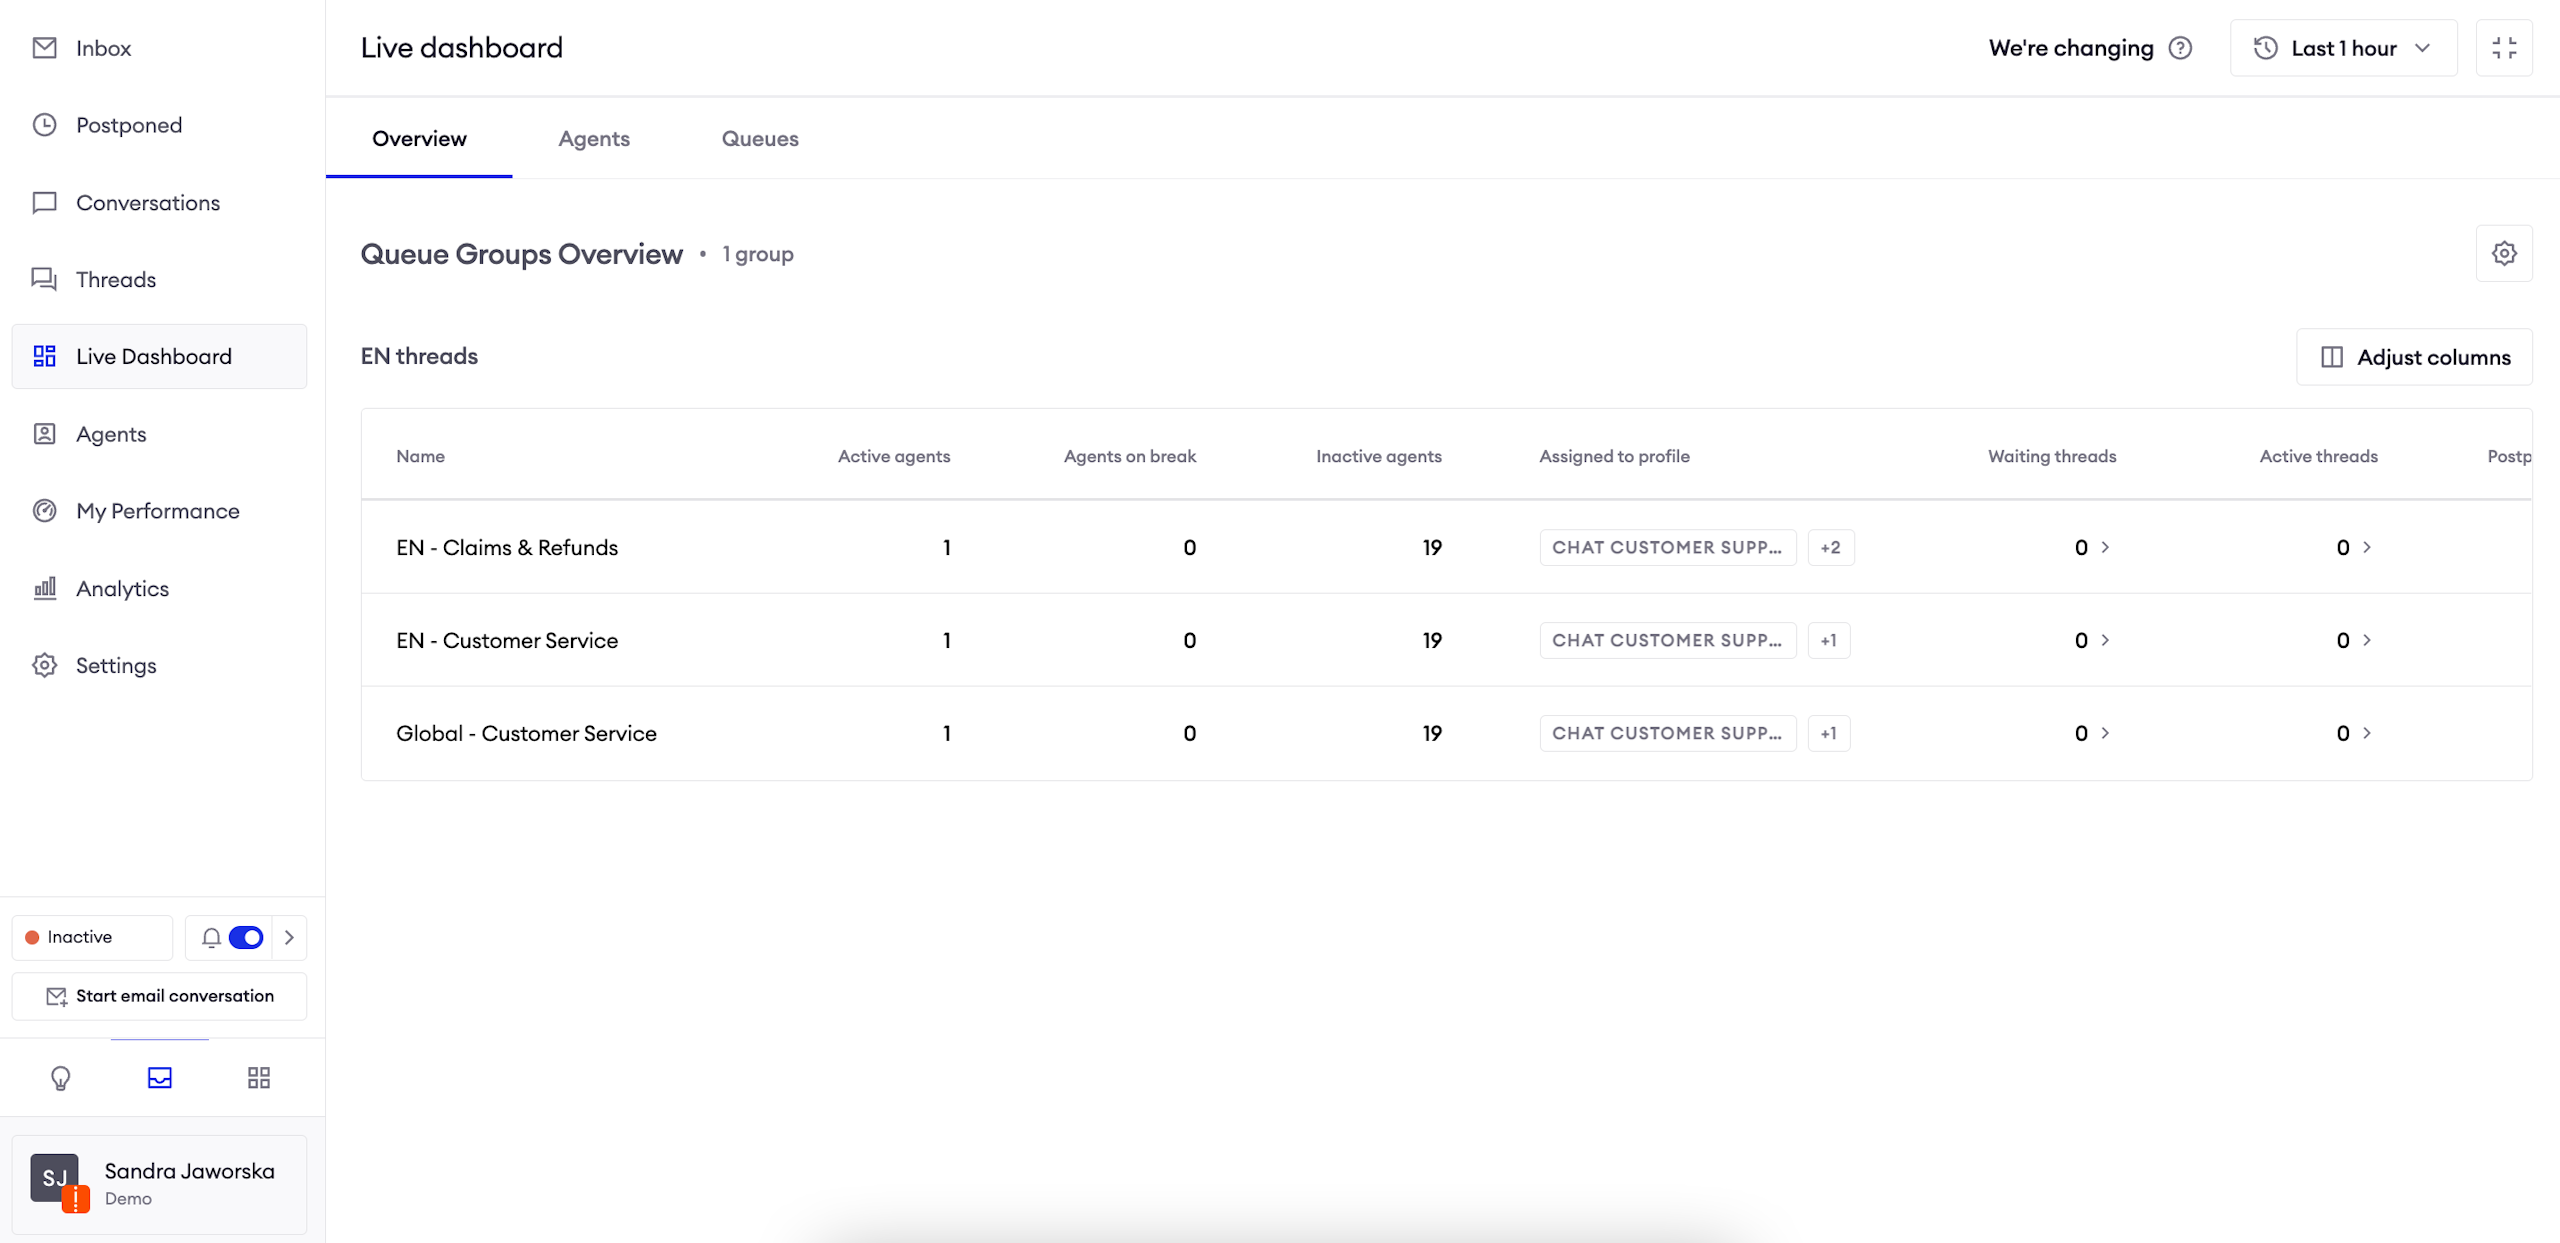
Overview tab
This section allows you to customize the view in a way that it displays the most valuable statistics for you. The system will remember those settings so each person in your company can set their own layout which will not change until they update it. This feature allows you to get crucial insights fast and react if you see that your agents need any kind of assistance.
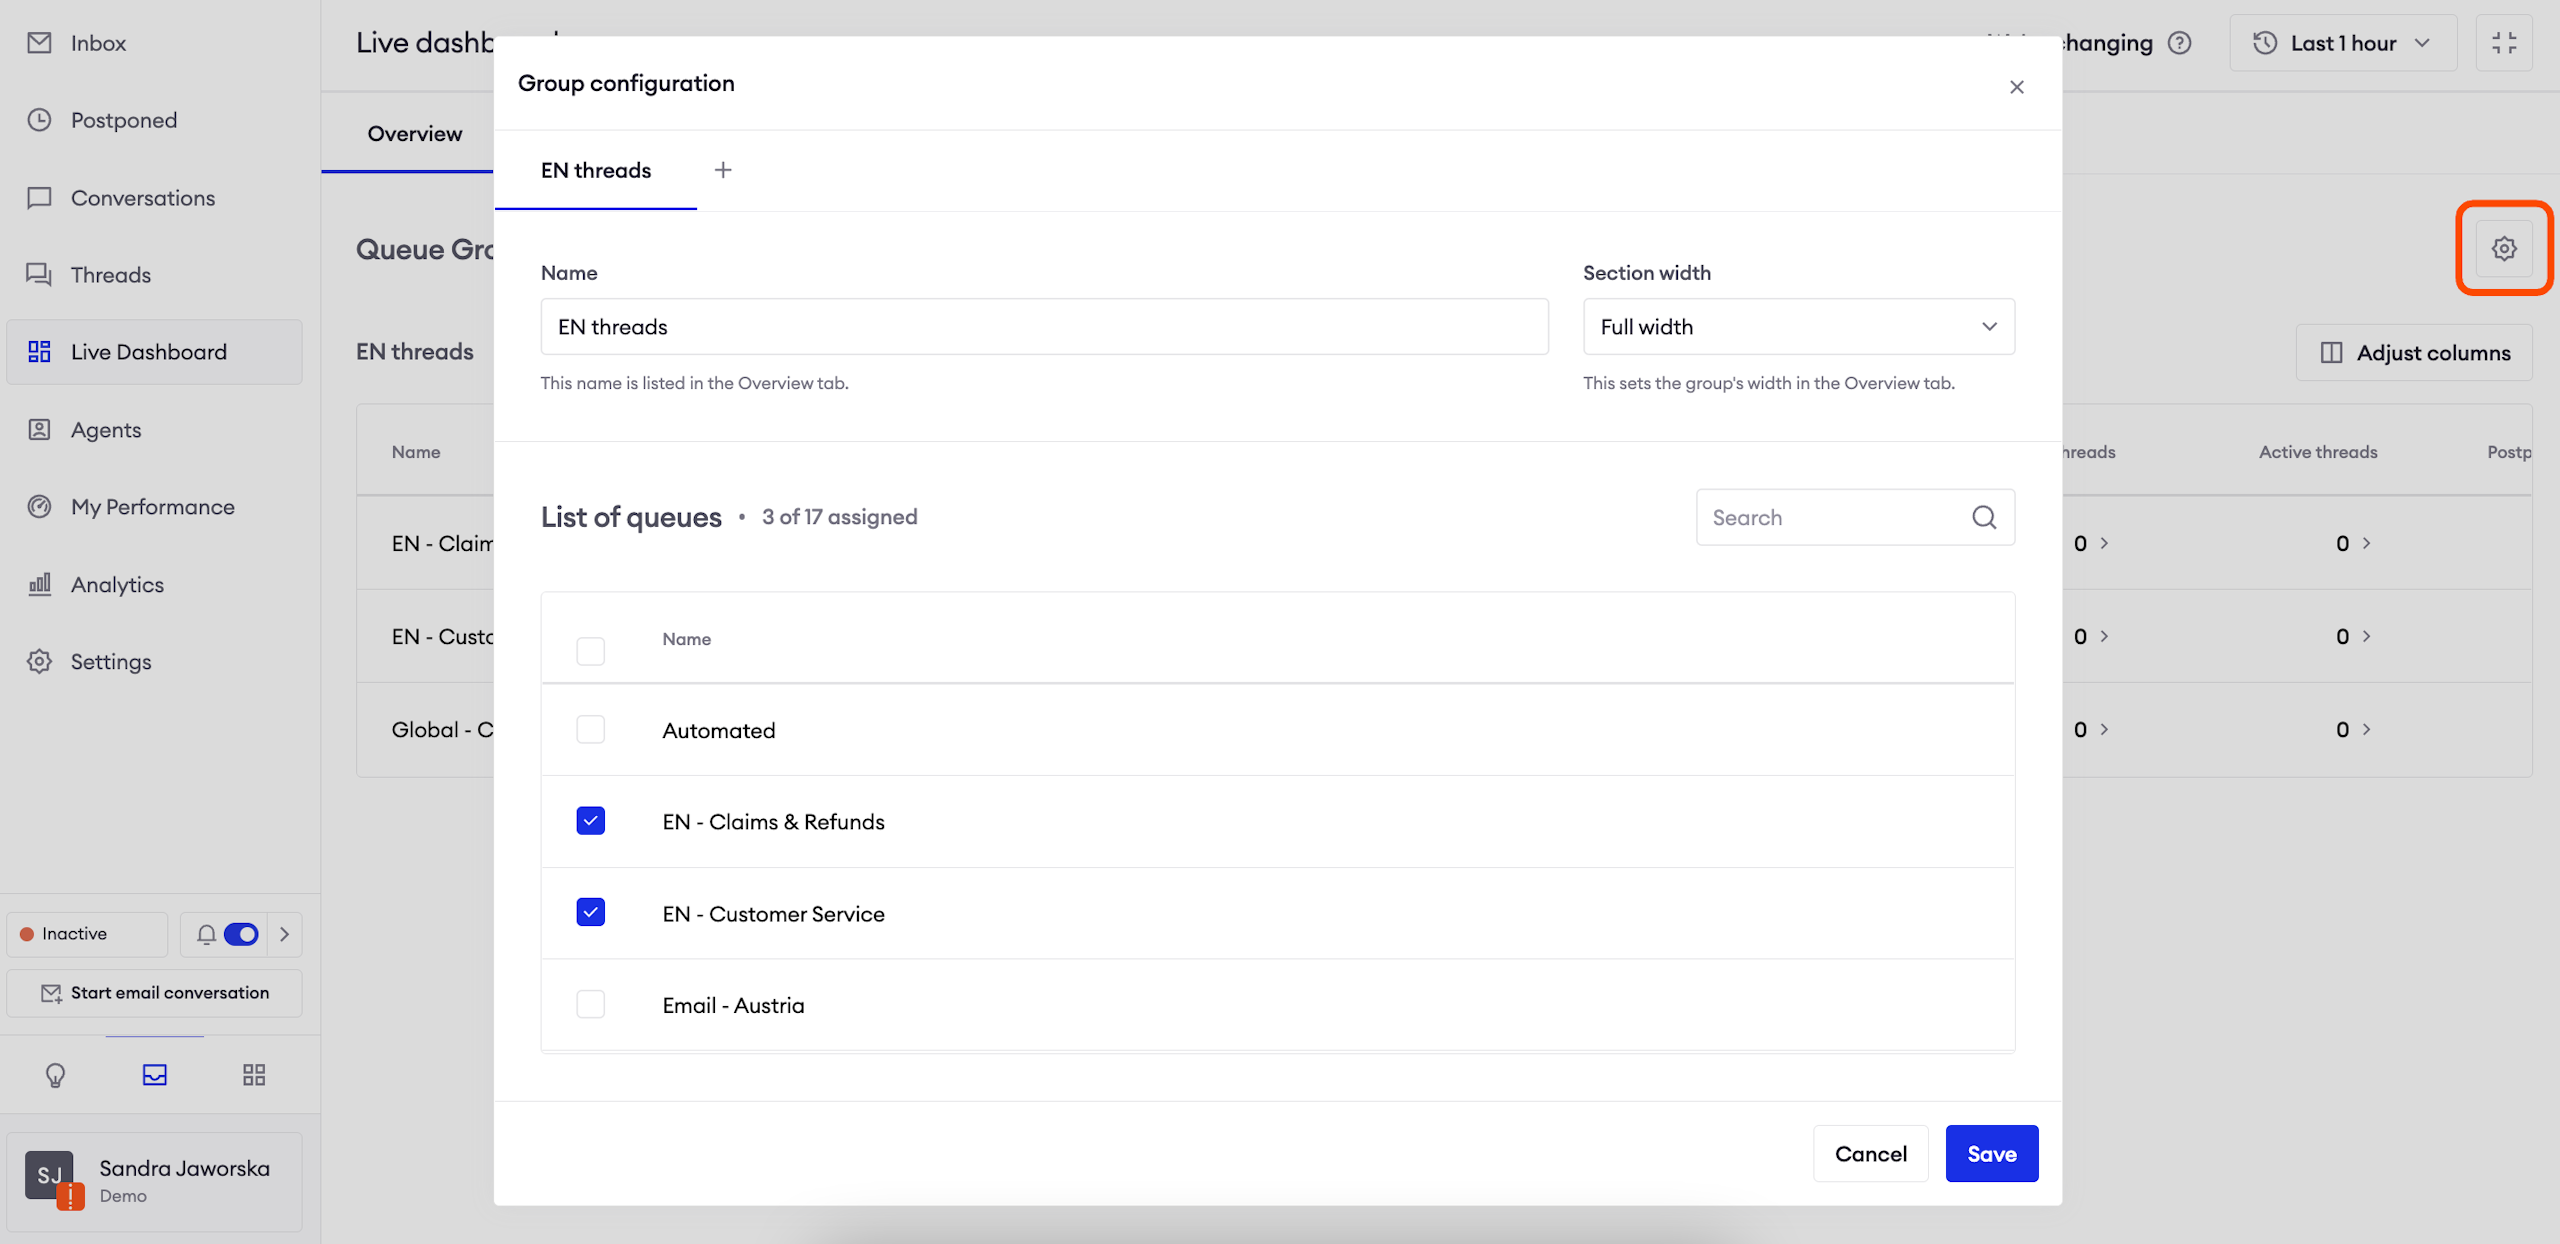
Configuration
In order to configure this view, you need to click the icon in the top right corner and select relevant options. You can arrange added groups in any order. Each group has the following properties:
- Name;
- Section width: determines how big the section is in the Overview tab;
- List of queues: which queues should populate the group.
You can customize the Overview tab even further! Each group has a separate "Adjust columns" button which allows you to select and reorder columns in the same way as in the Queues tab.
Agents tab
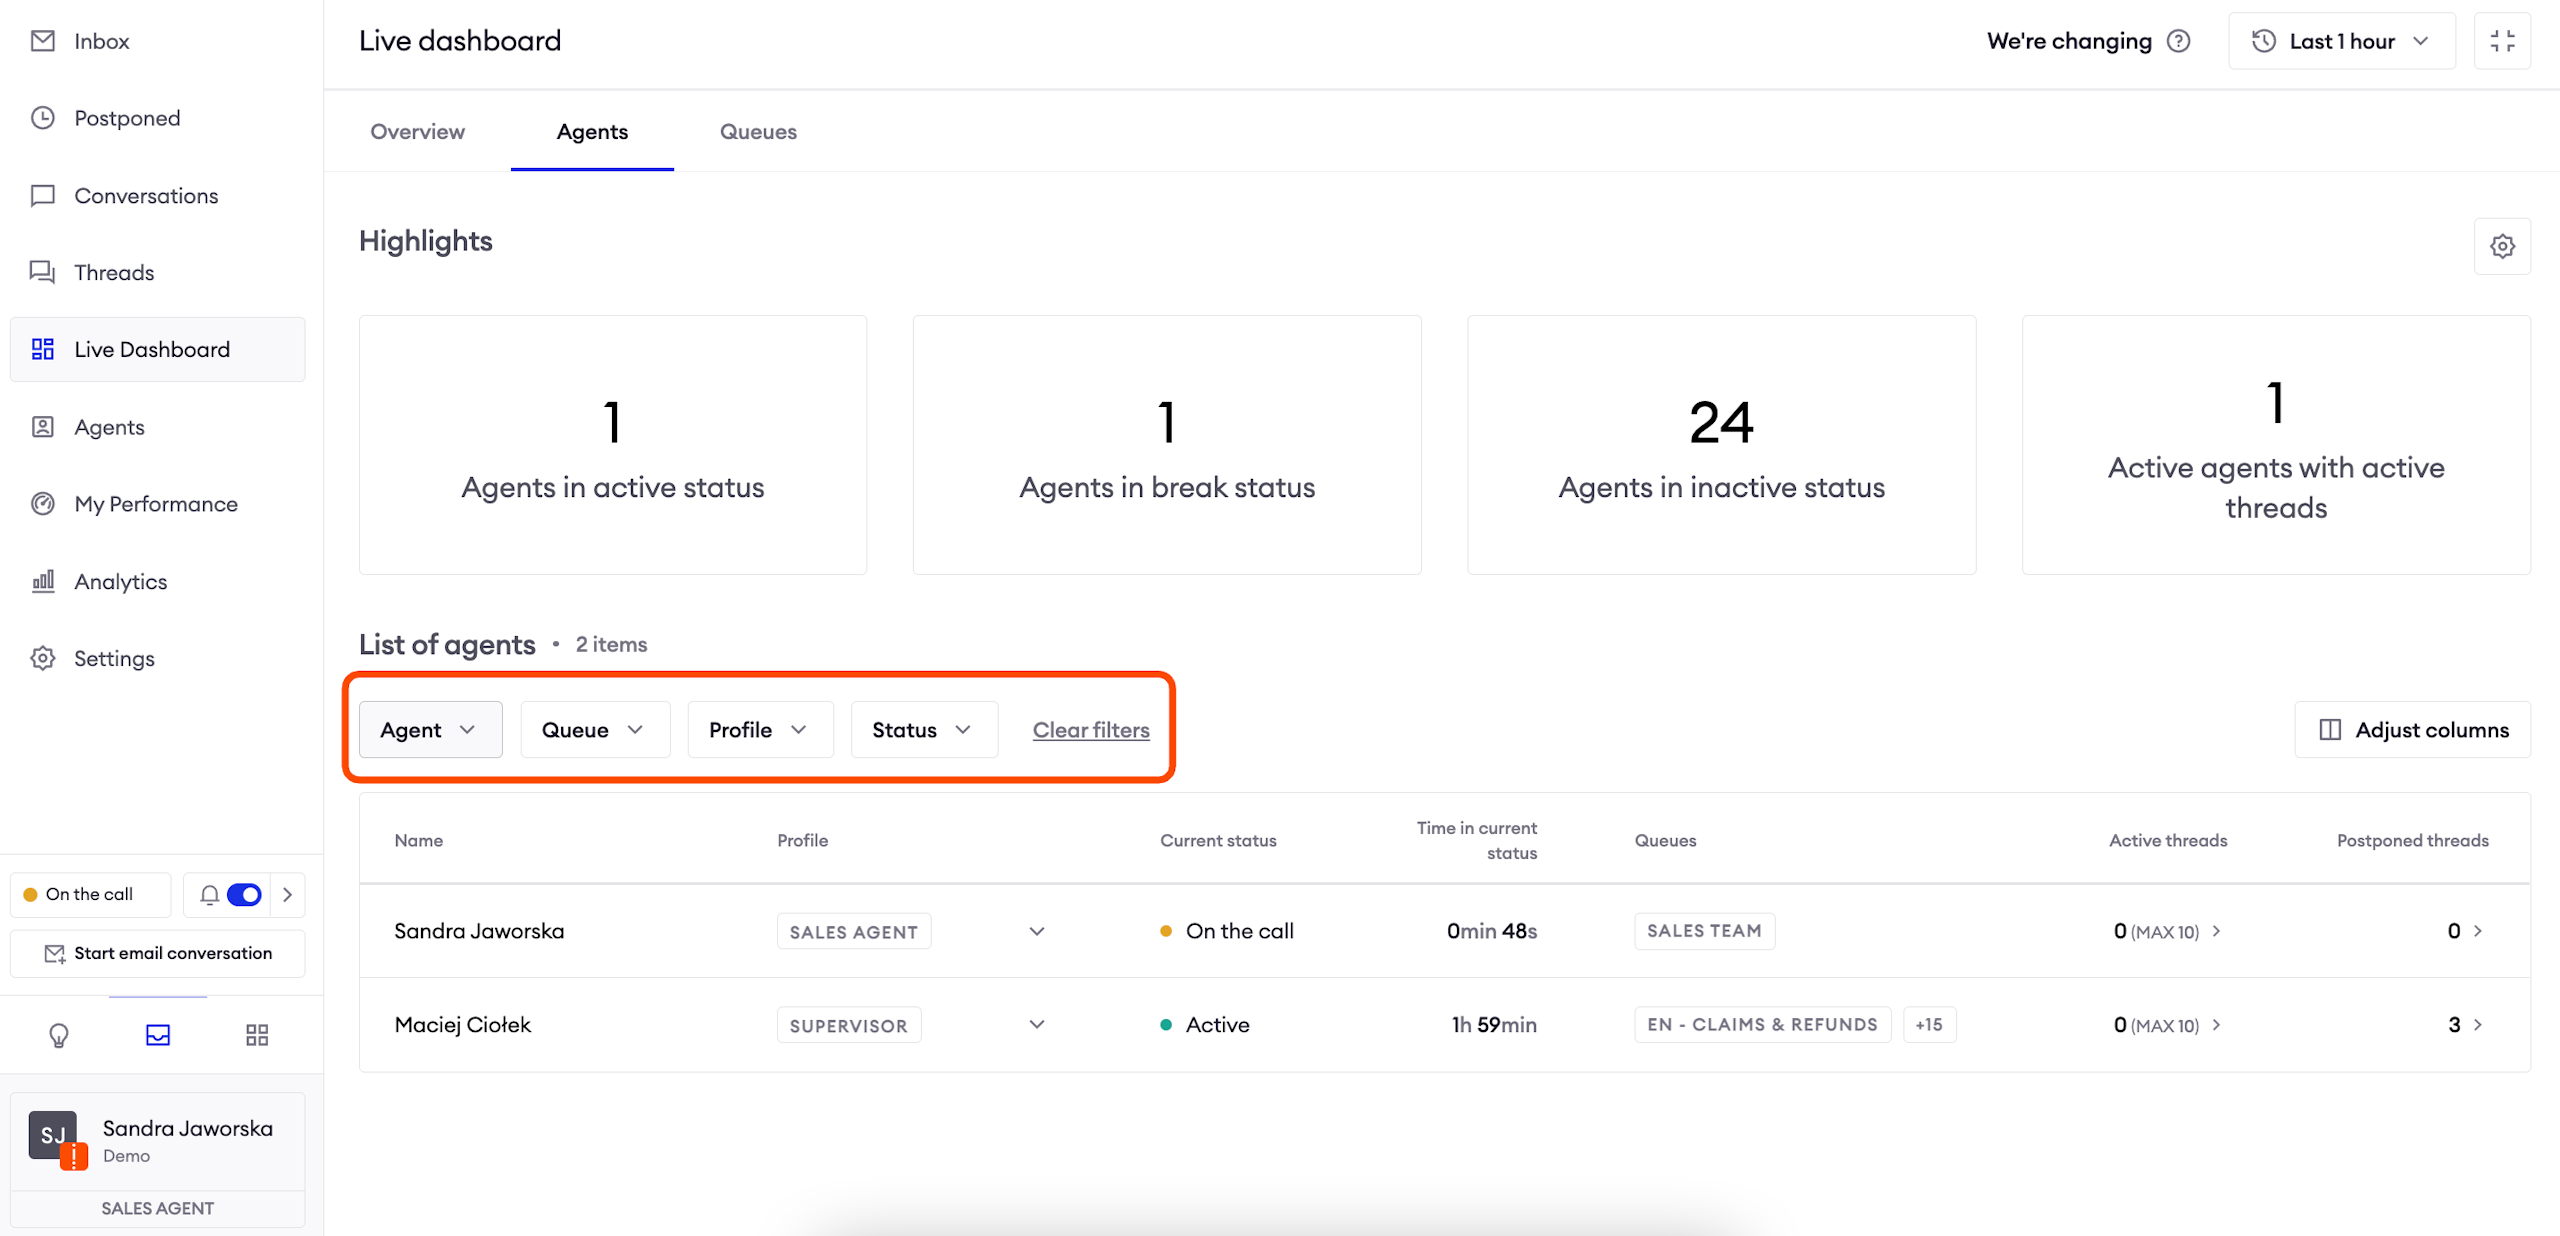
This section shows you the performance of your agents. You can freely customize the display of columns using the "Adjust columns" button.
You can select any number of the following filters:
- Agents;
- Queues;
- Profiles;
- Statuses.
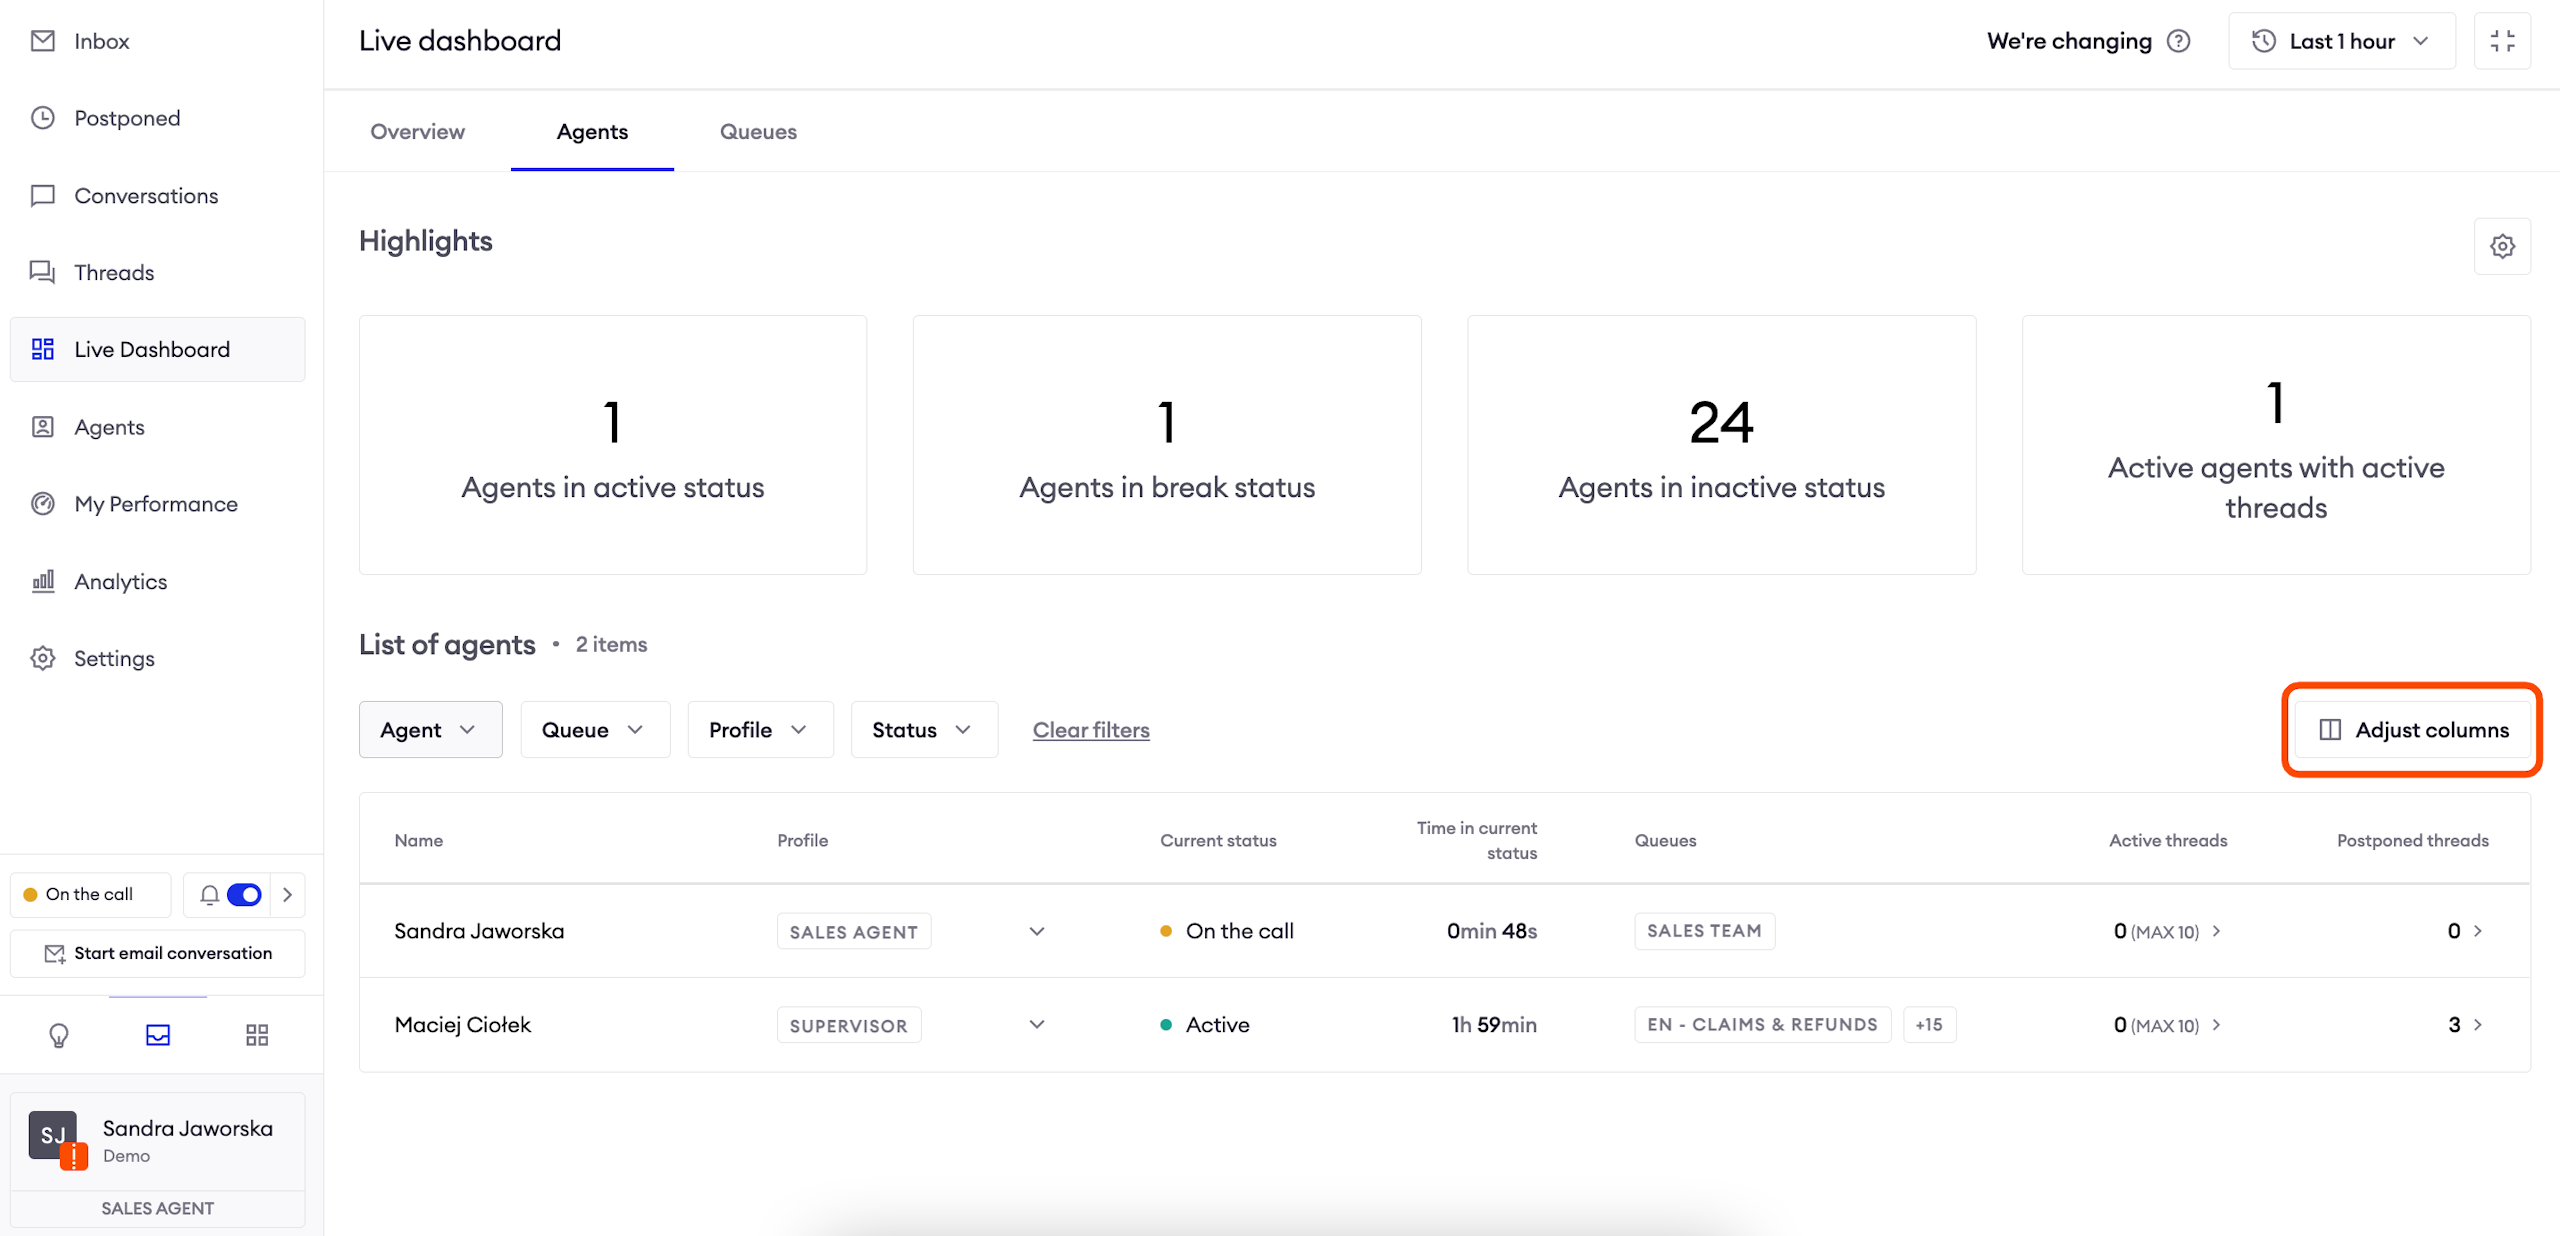
Columns
In order to select the columns you want to display, click on the button in the right corner. You can also configure the order in which columns should appear. The system will remember these settings until you change them.
Note:some of the columns allow you to click on displayed values and see the list of matching records. Remember that you need to enable appropriate access in the Profile configuration in order to see that content.
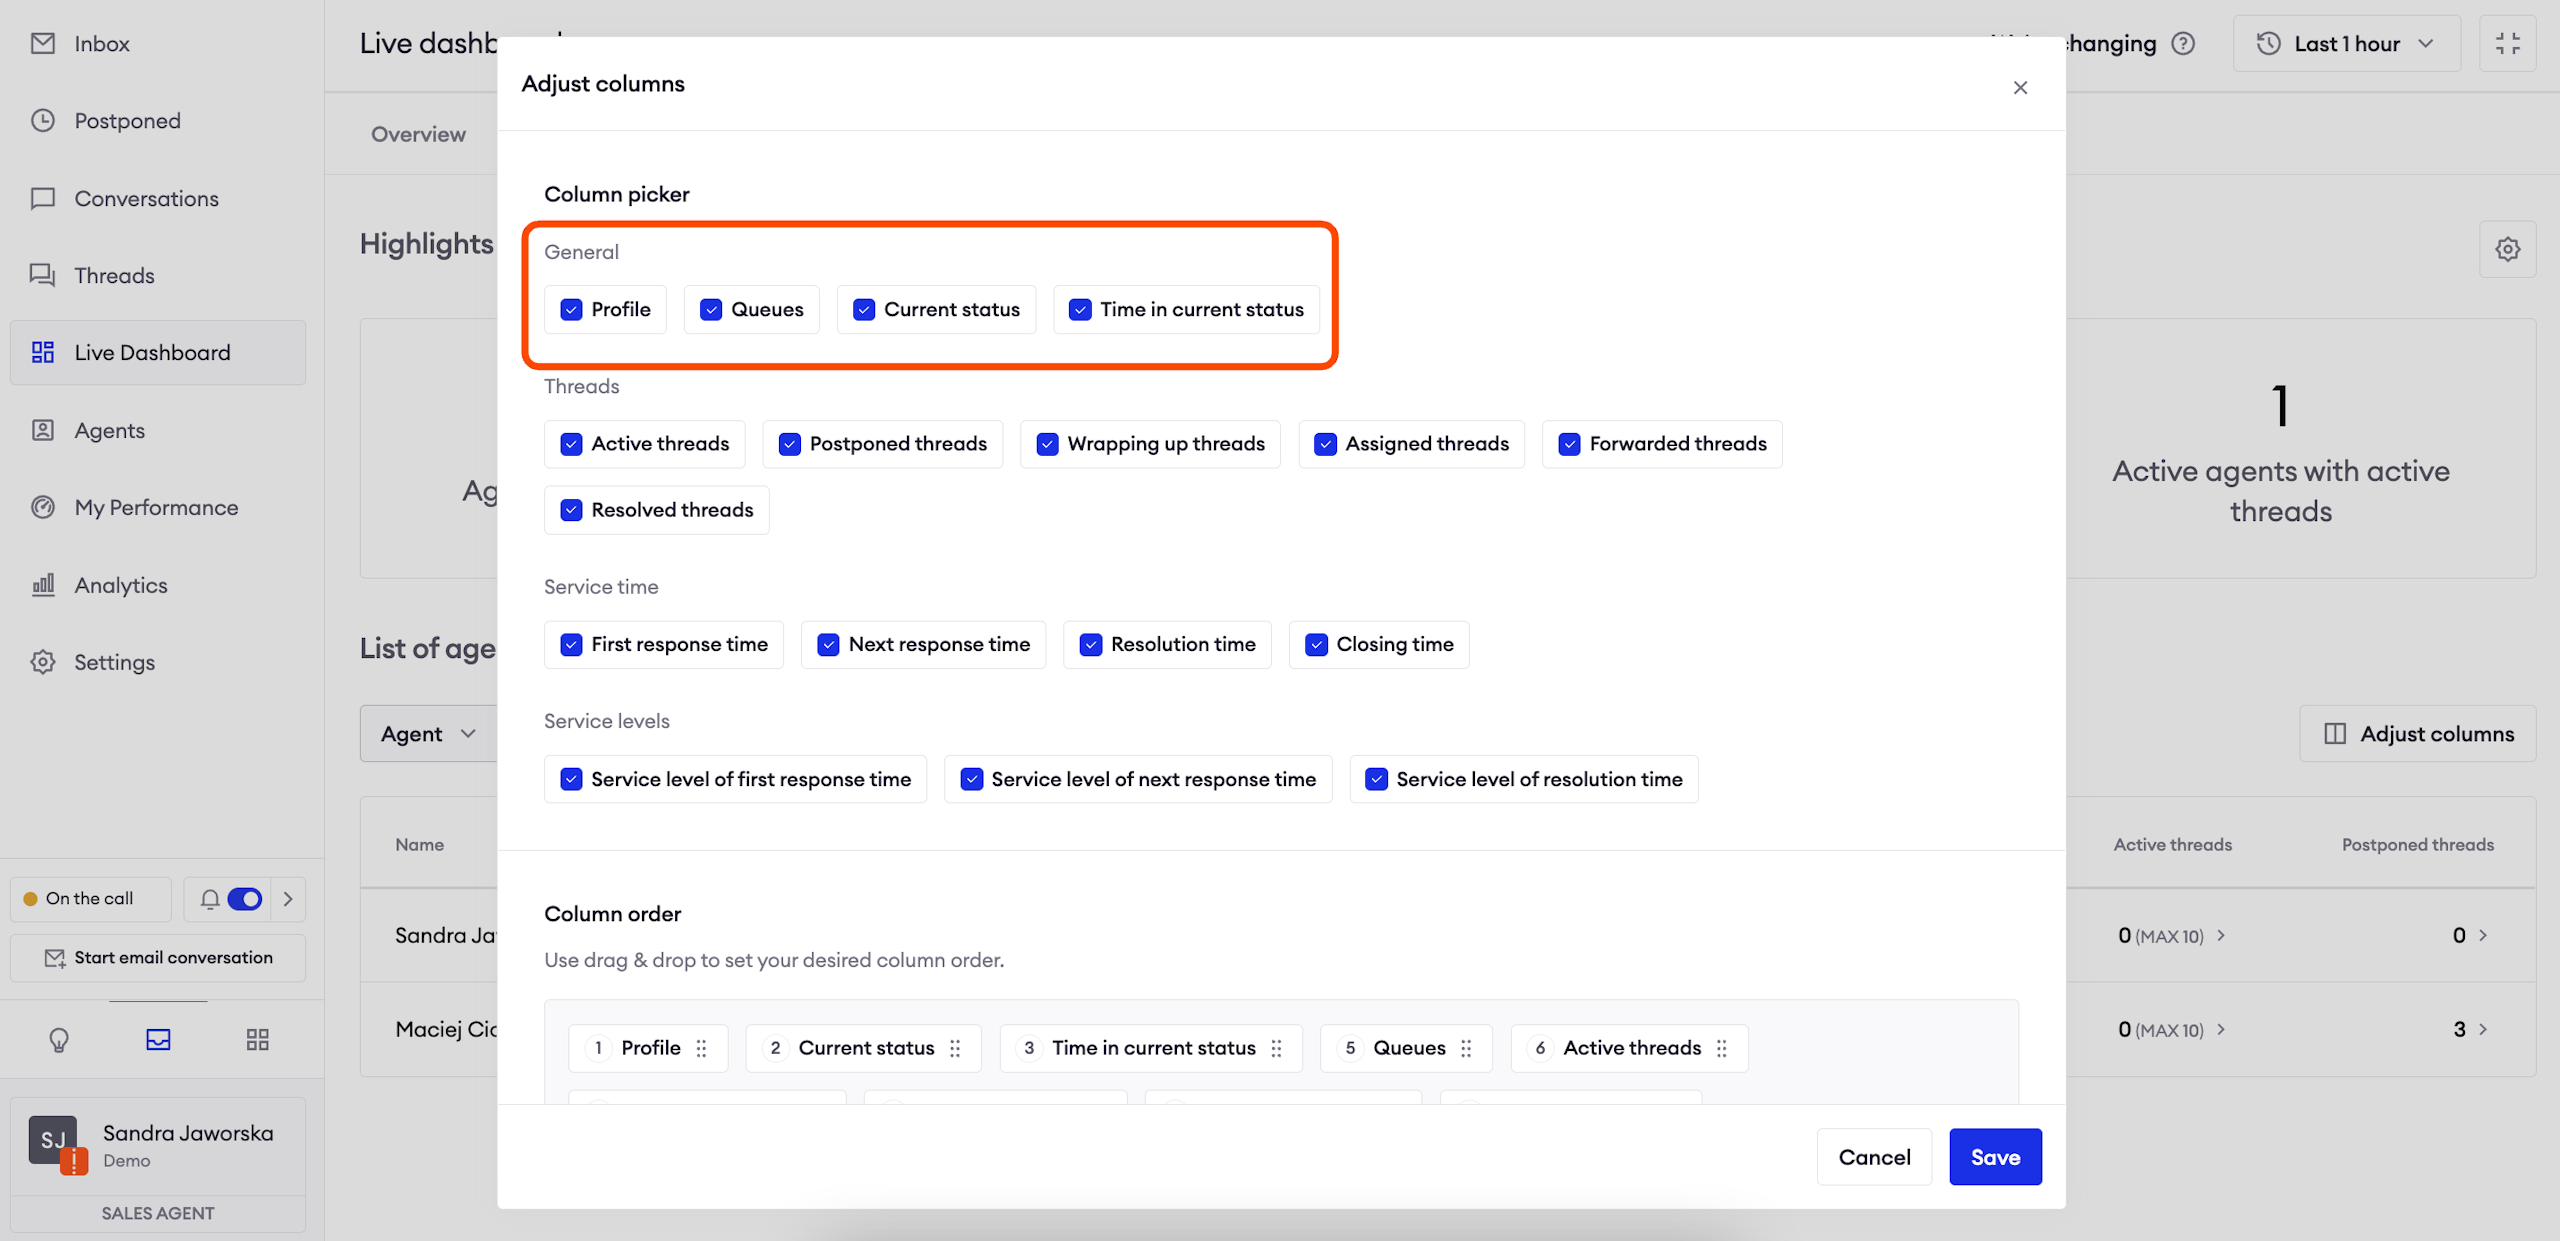
General
Profile: Agent’s current Profile. You can reassign an Agent’s Profile from this view.
Queues: Queue from which the agent will receive chats. You can configure it in the Profile settings.
Current status: agent’s current status.
Time in current status: how long the agent has been in current status.
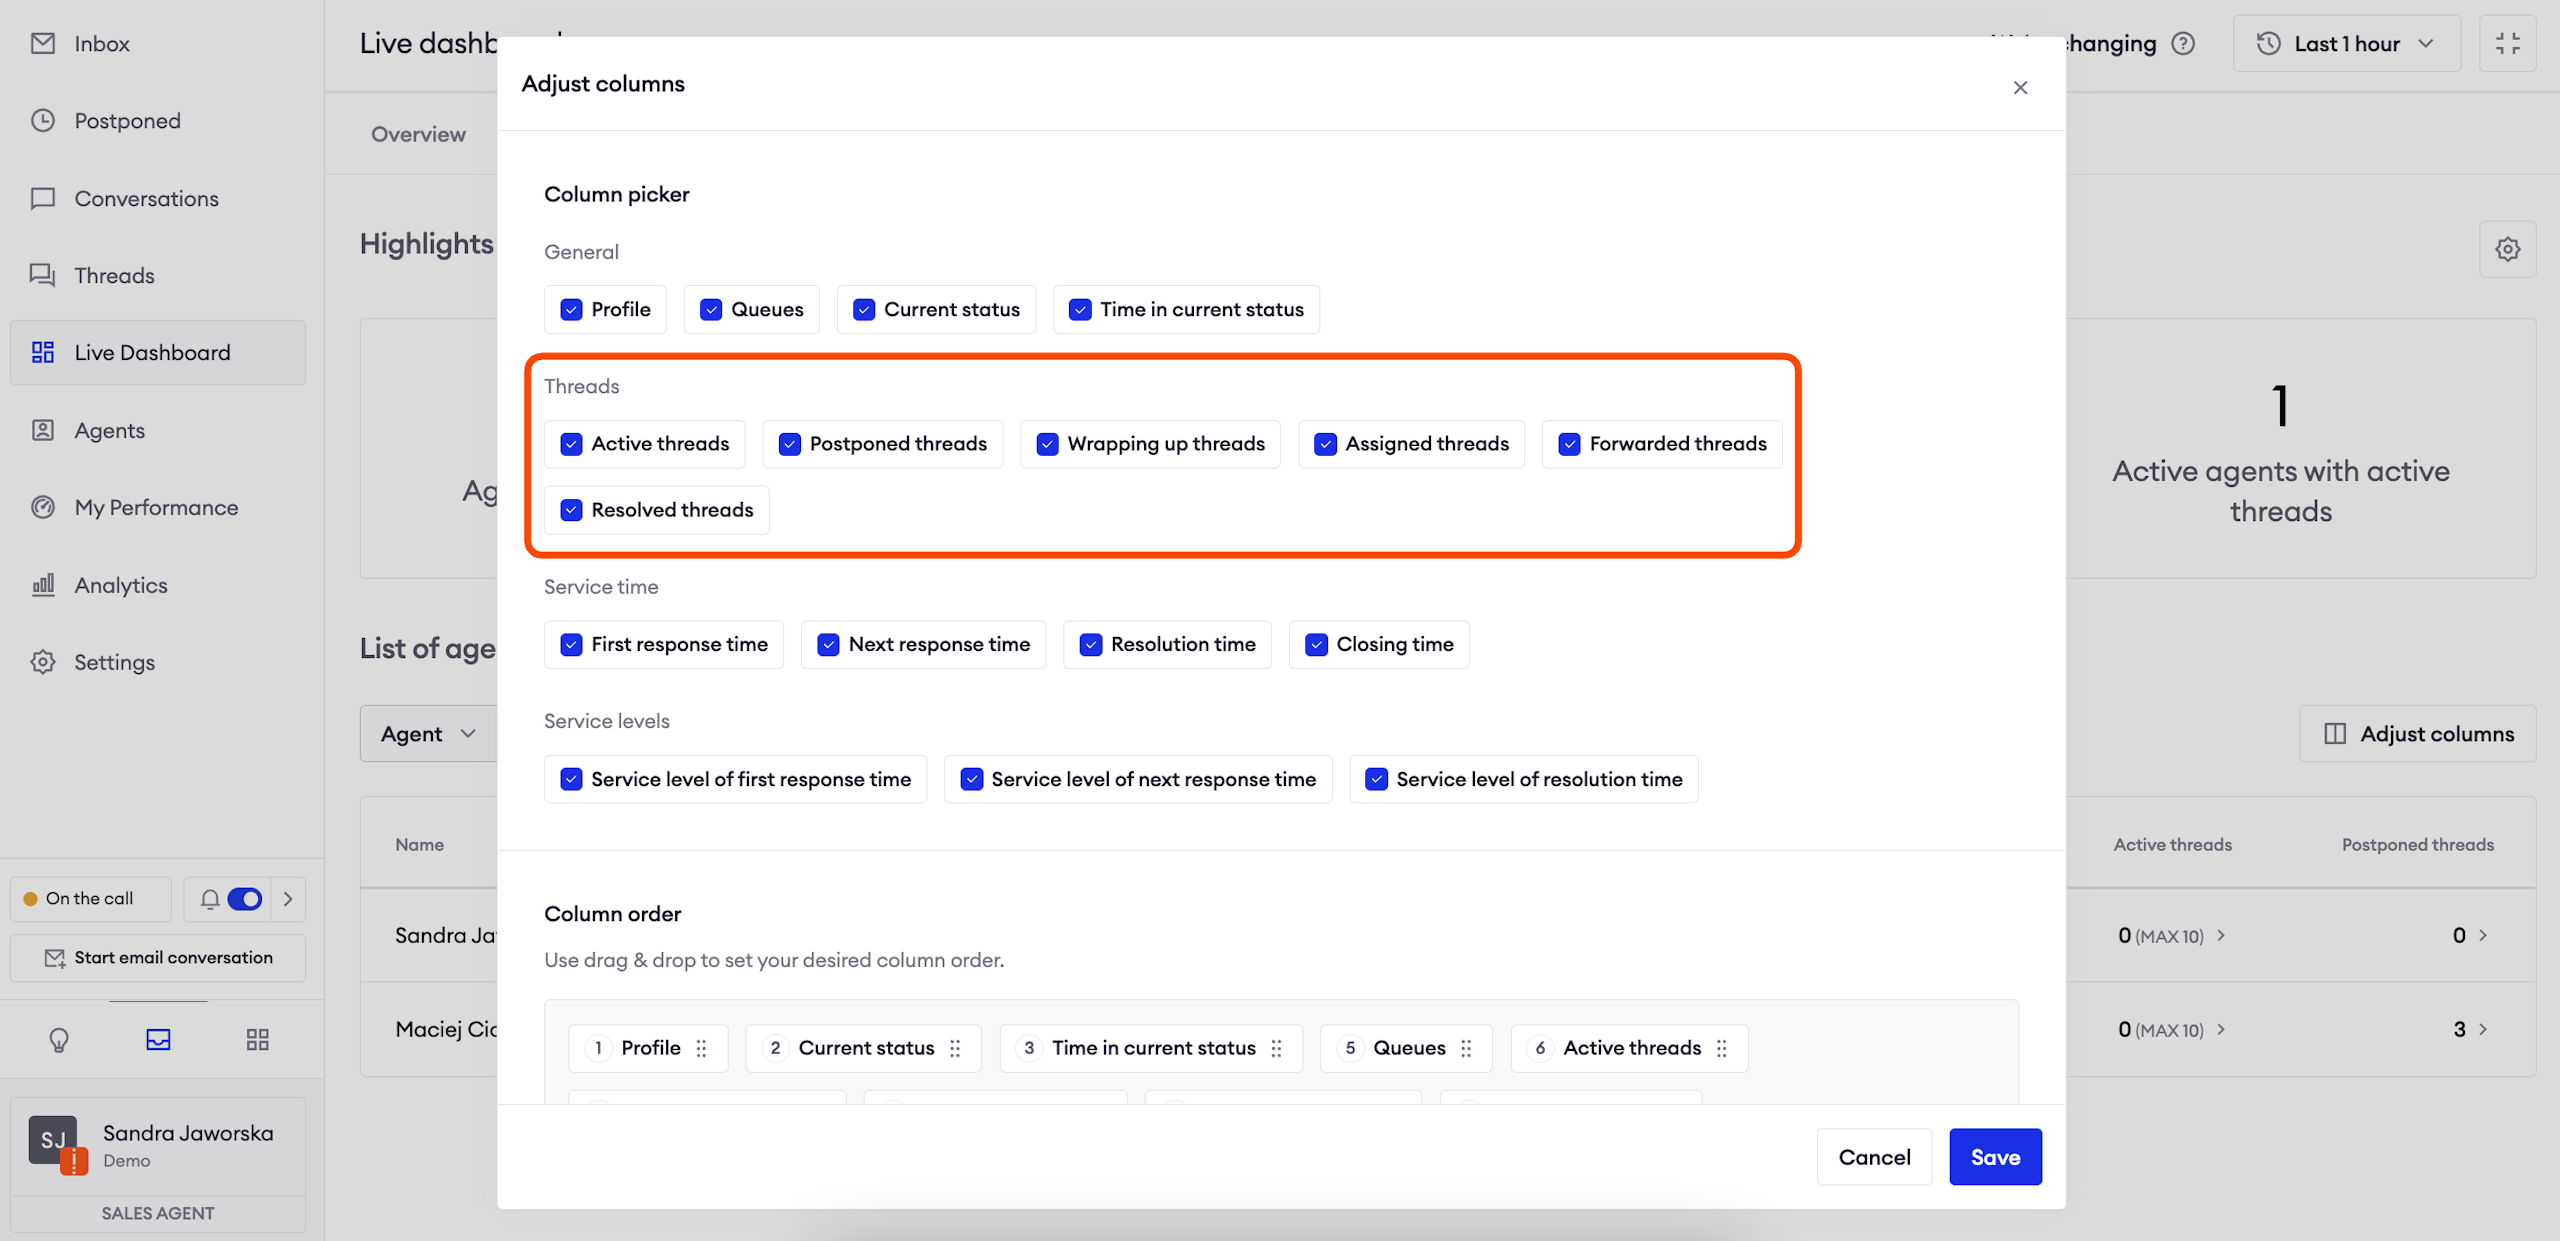
Threads
You can click on displayed numbers to see the exact list of matching threads, if your access level configured in the Profile settings allows it.
Active threads: how many conversations which have not been marked as done are currently assigned to the agent; postponed conversations will count towards this statistics. The number in the brackets shows you the current maximum number of active threads (this setting can be found in Profiles, and the number on the dashboard represents the sum of both limits).
Wrapping up threads: how many conversations are being wrapped up by the agent; in order to see any values in this column, you need to configure Wrap up in the Profile settings.
Assigned threads: how many threads were assigned to the agent within the selected period; it is different from Active threads because it also counts threads which were passed from this agent to other agents or queues. Mass marked as done threads will be counted towards these statistics.
Forwarded threads: how many threads the agent forwarded to other agents or queues in the selected period.
Resolved threads: how many threads the agent resolved (marked as done) during the selected period; threads resolved by mass mark as done are also counted towards this statistics.
Service time
First response time (FRT): what the average, minimum and maximum first response time for an agent is within the selected timeframe.
- Agent’s FRT is counted as the time between the moment a chat is assigned to an agent, and the first response the agent sent in that conversation.
- Average is counted based on all FRTs from the selected period.
Next response time (NRT): average, minimum and maximum time it took an agent to send the next reply to the user.
- Agent’s NRT is counted as the time between the user’s message and the agent’s reply to that message (excluding first response). We take all next response times in the conversation, count an average and display it as NRT.
- Average is counted based on all NRTs from the selected period.
Resolution time: what is the average, minimum and maximum resolution time in the selected timeframe.
- Resolution time starts the moment the user initiates handover until the agent marks the chat as done; it means that waiting in the queue counts towards resolution time as well.
Closing time: what is the average, minimum and maximum closing time in the selected timeframe.
- Closing time is counted as the time between the last message in the conversation (either by the agent or the user) and the mark as done action. We count it only for resolved threads where the agent who wrote the last message to the user marked the conversation as done, which means that mass marking the conversation as done will not count towards this statistics.
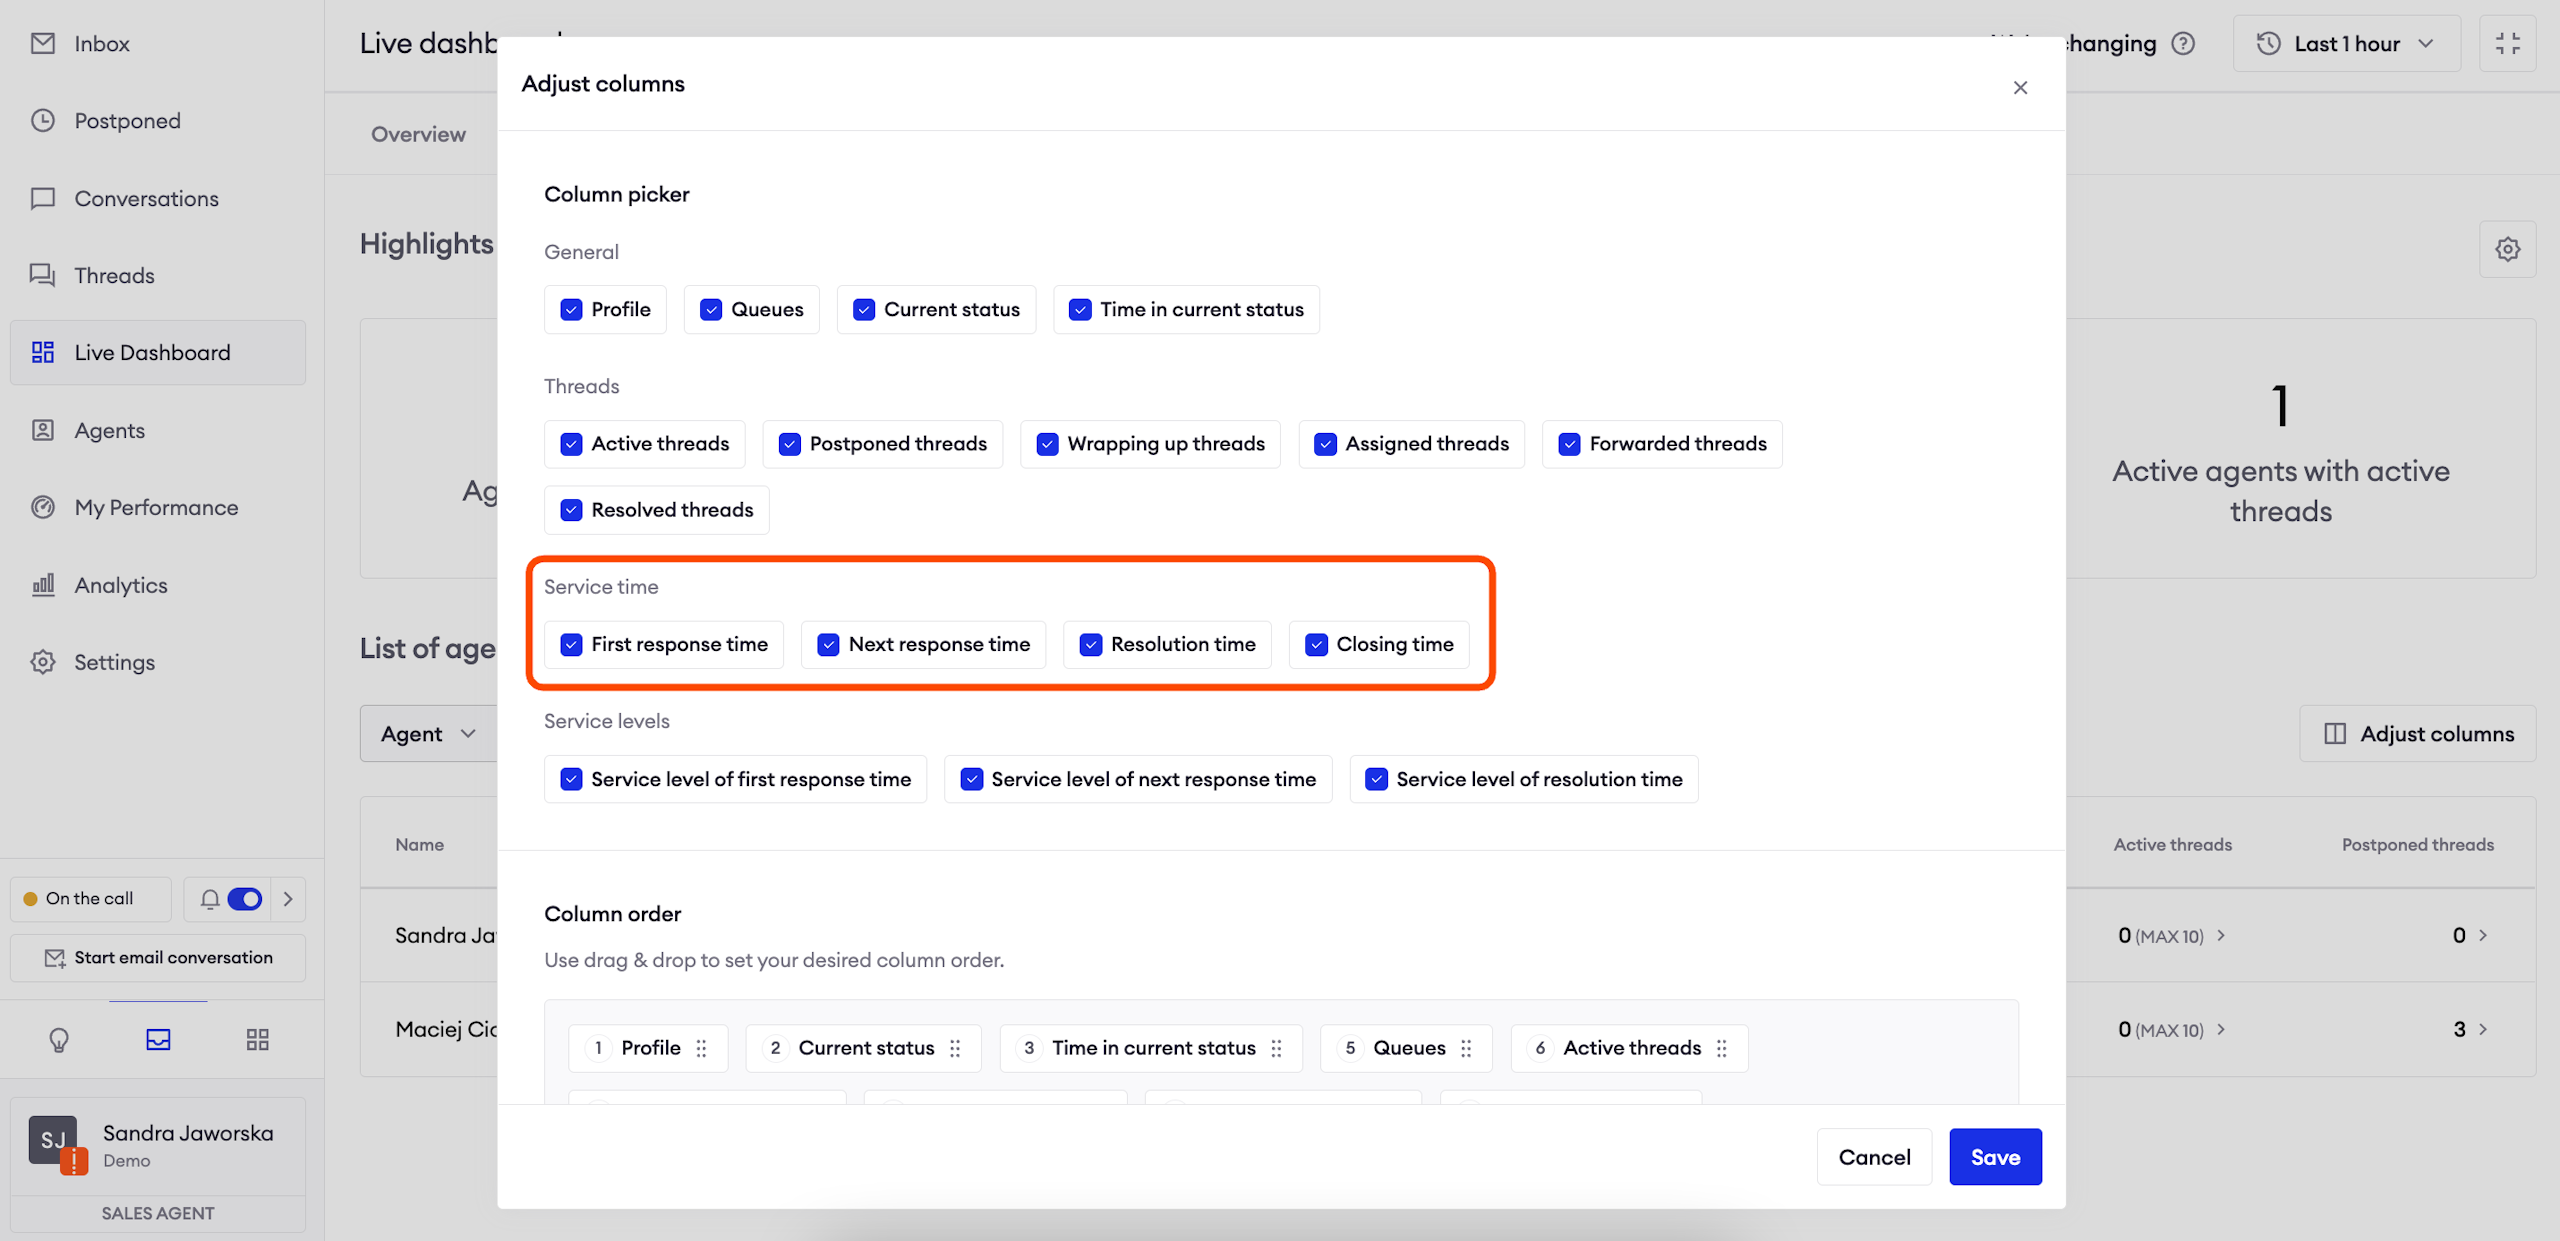
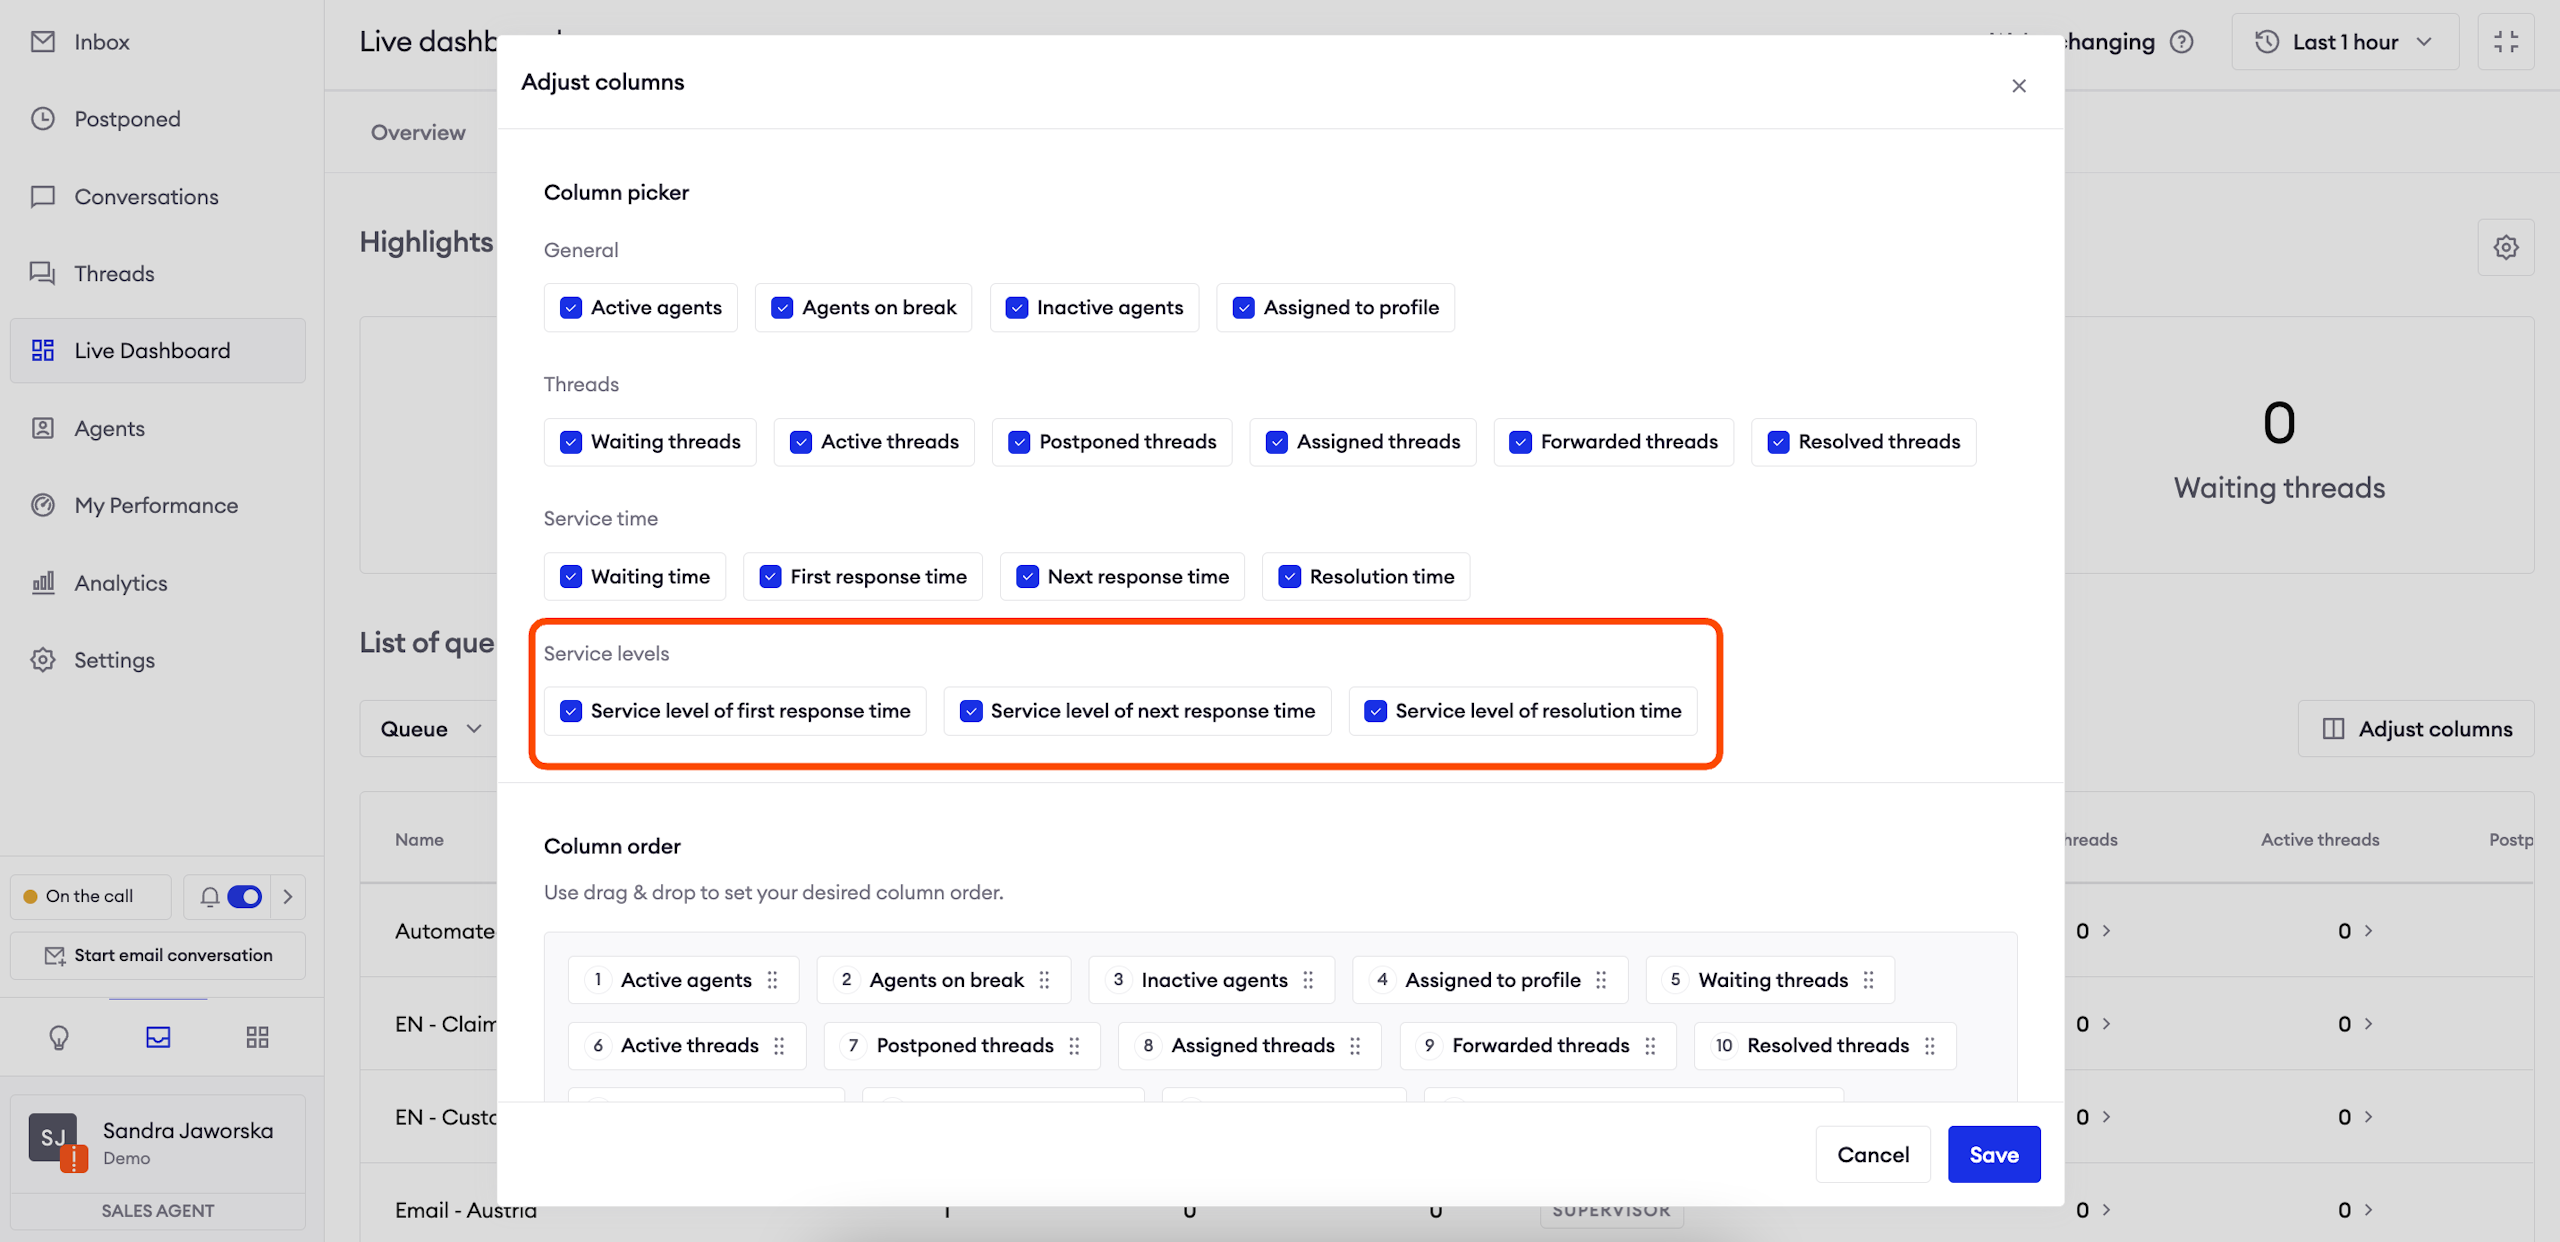
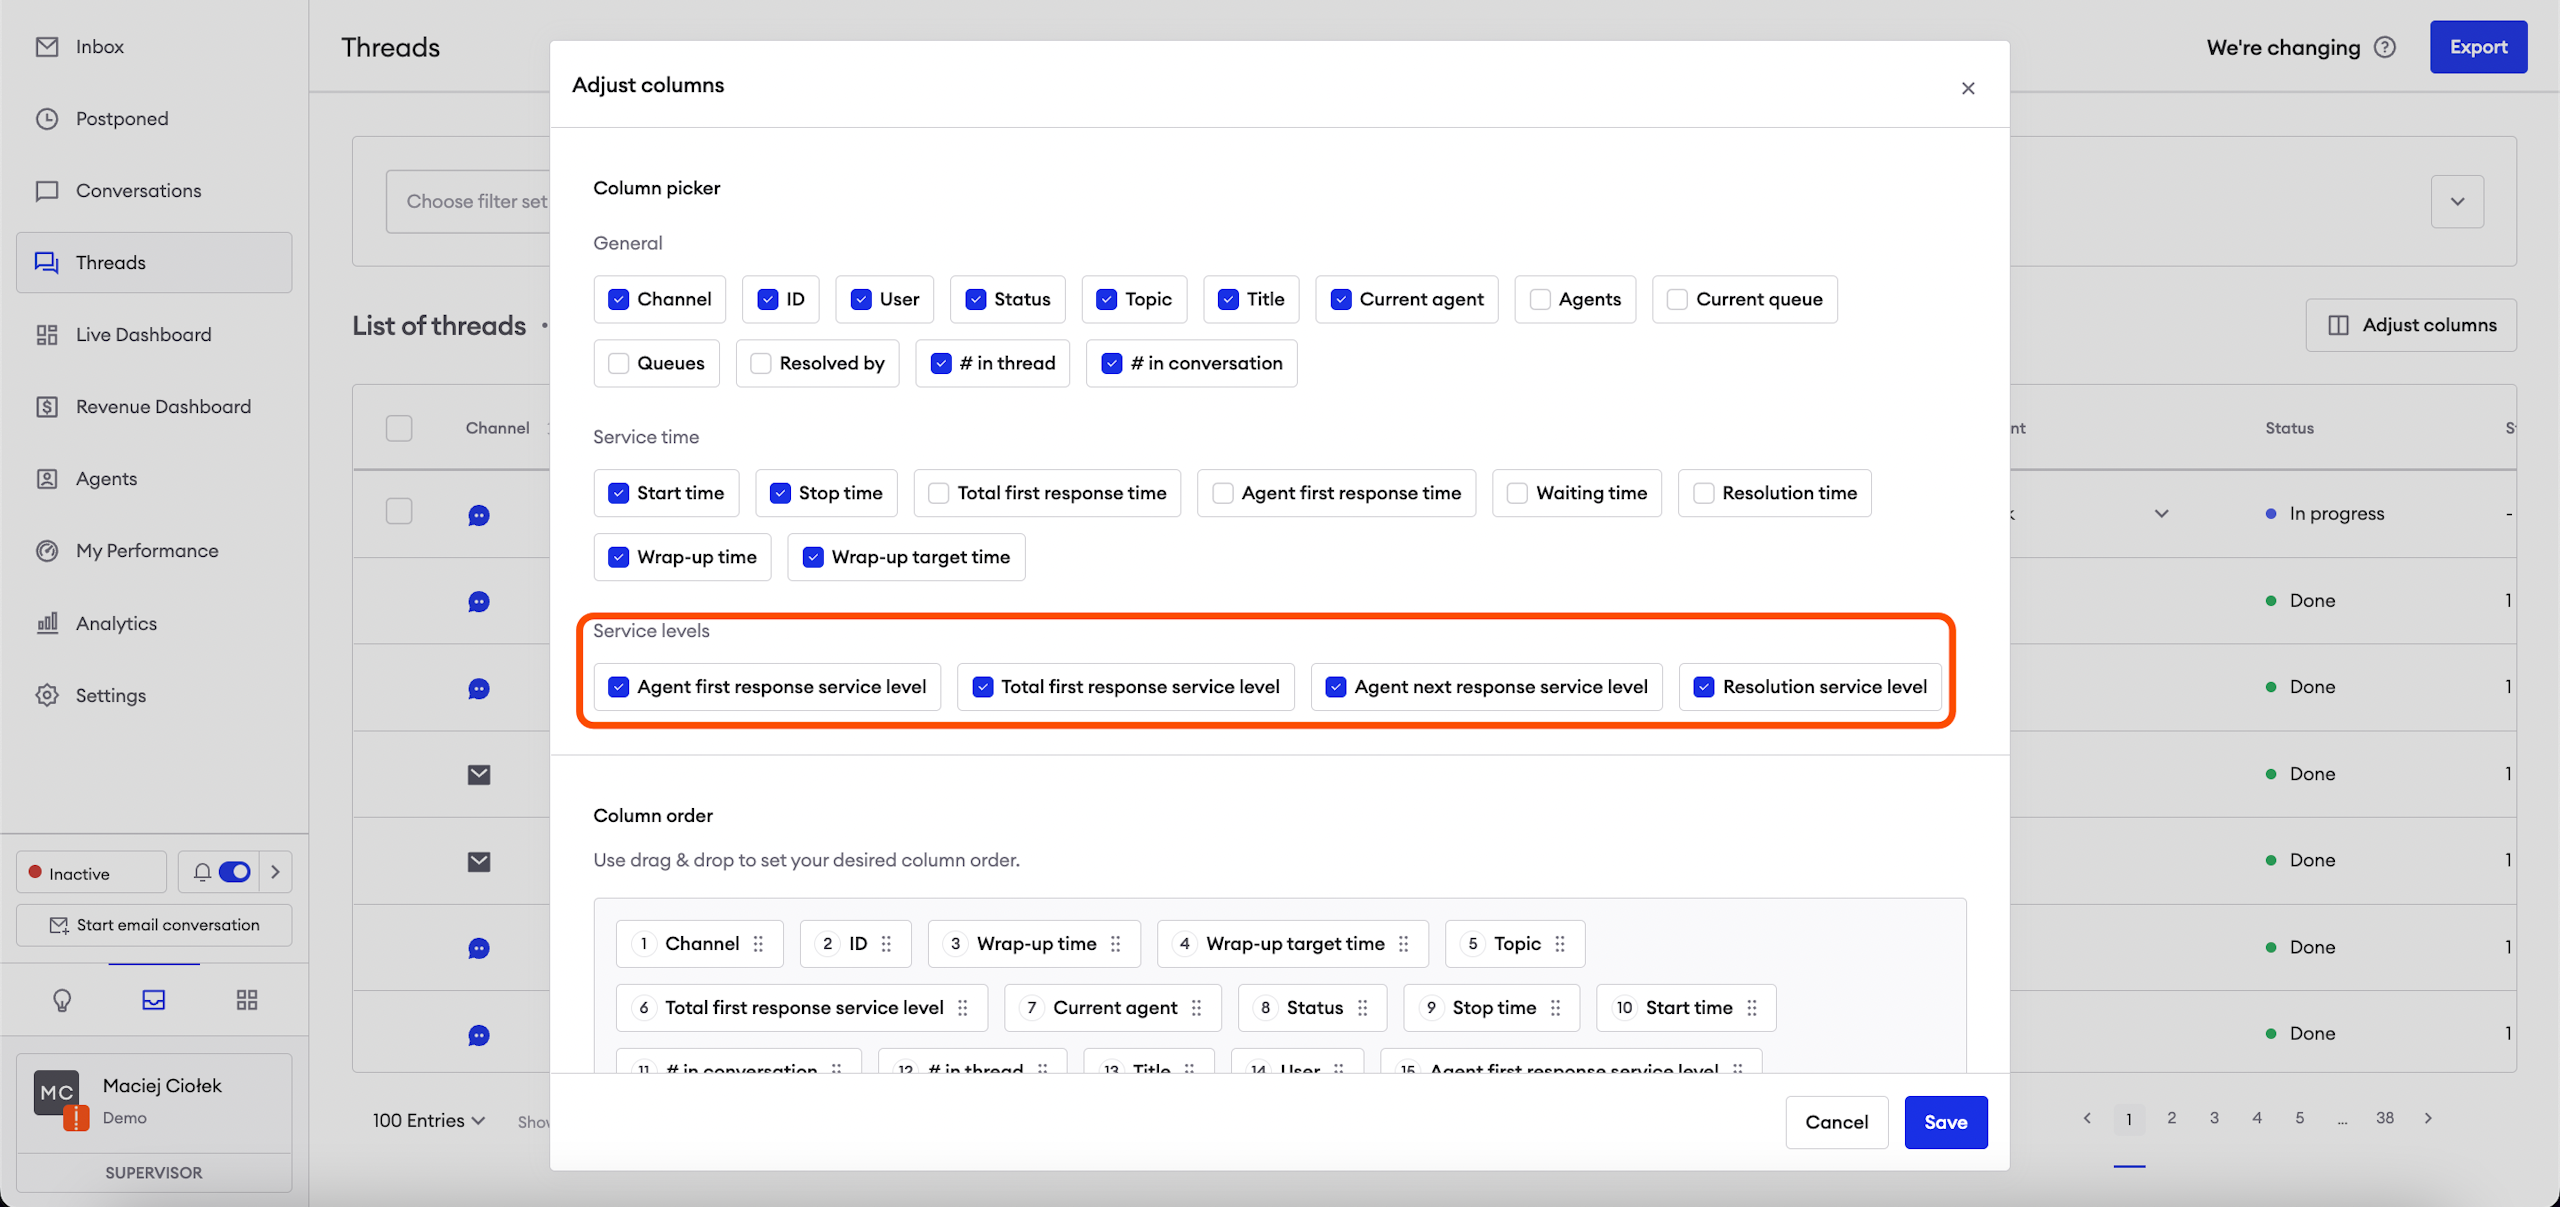
Service level
Service level of FRT / NRT / Resolution time: displays the percentage of chats in the selected period which met current SLA values.
Service level colors:
Green => SLA > 70%
Orange => SLA > 30%
Red => SLA<= 30%
Pause symbol - when SLA is paused from being counted because of SLA conditions
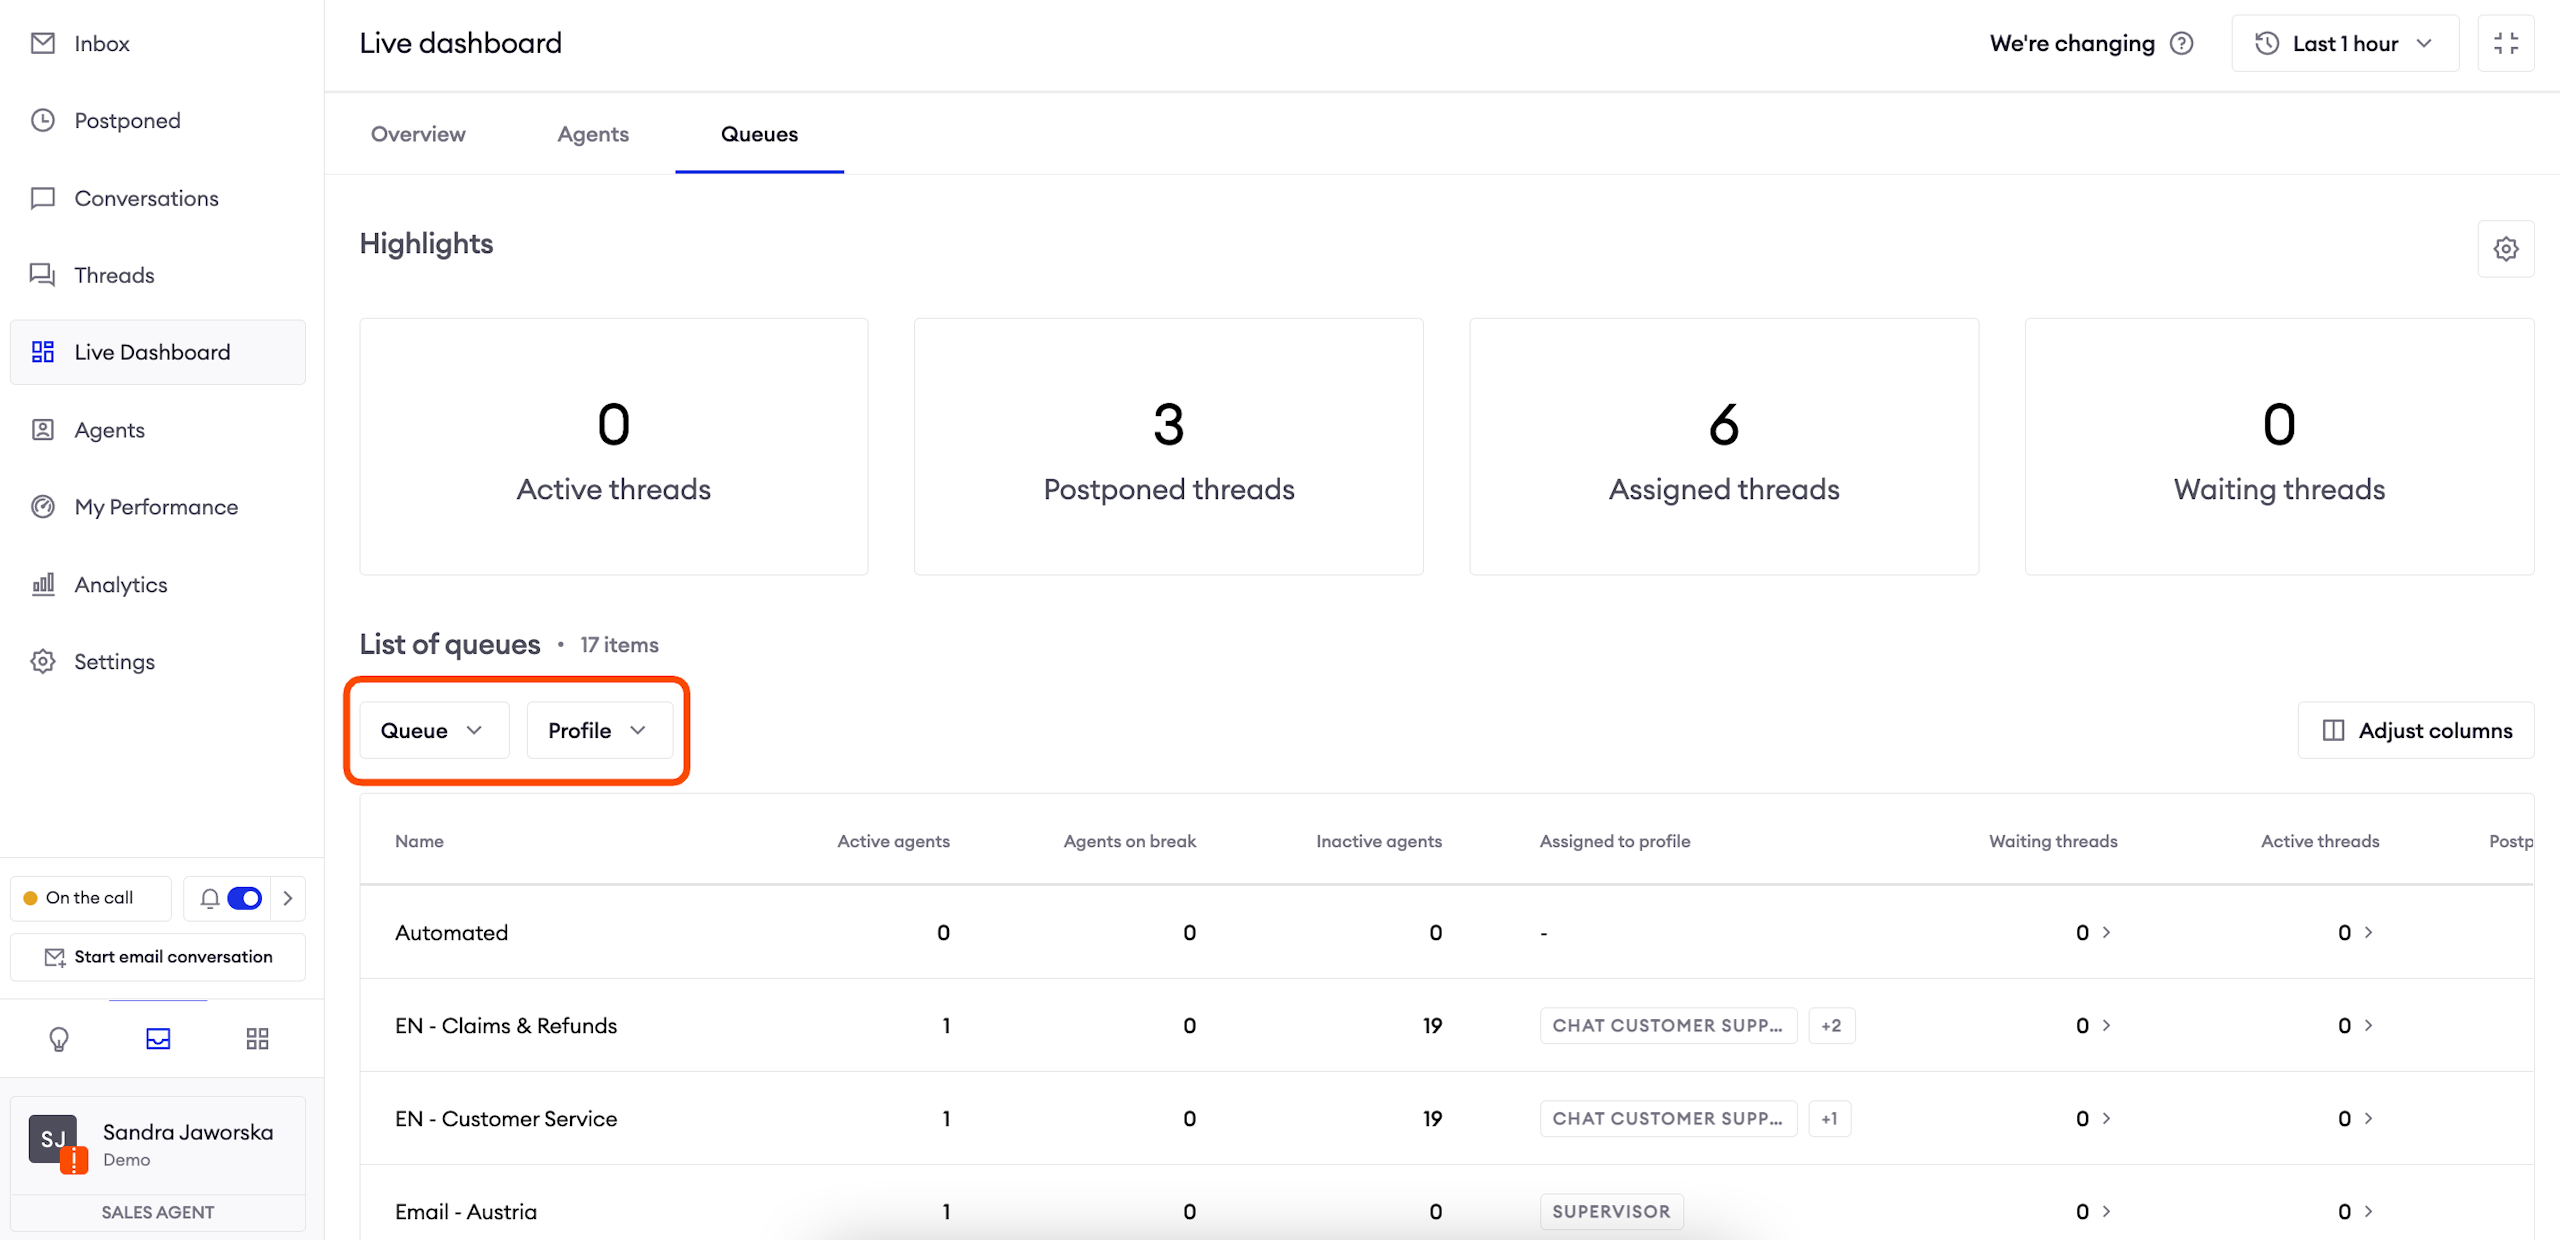
Queues tab
This section shows you the current status of each selected queue. You can freely customize the display of columns.
You can select any number of the following filters:
- Queues;
- Profiles.
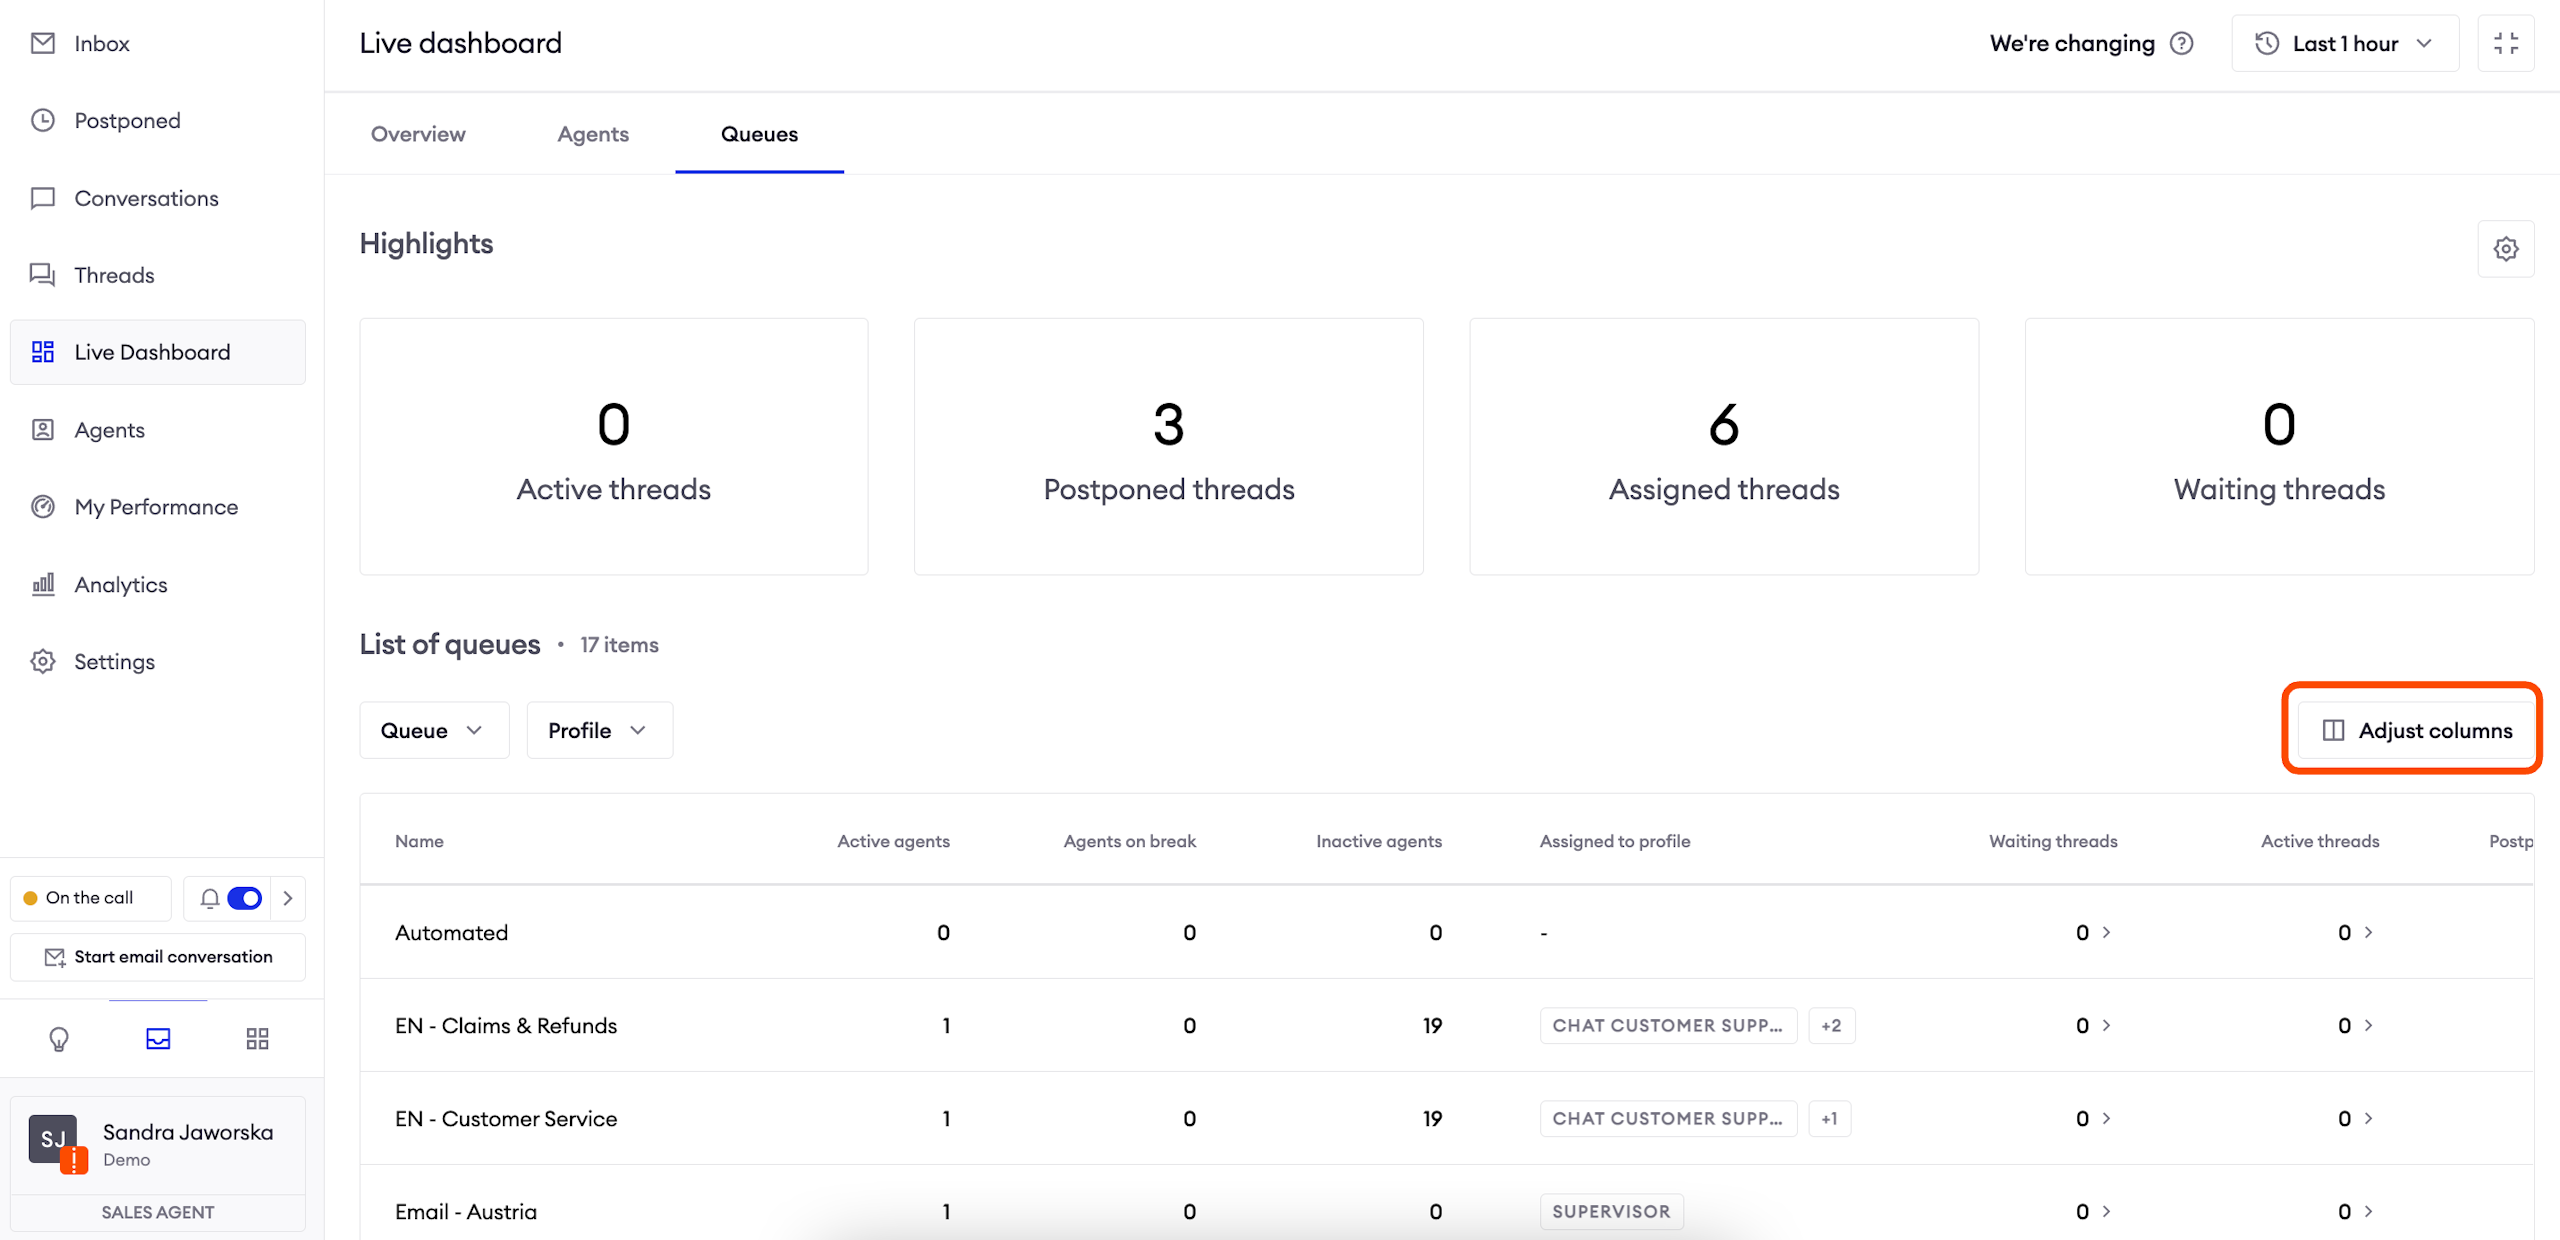
Columns
In order to select the columns you want to display, click on the button in the right corner. You can also configure the order in which columns should appear. The system will remember those settings until you change them.
Some of the columns allow you to click on displayed values and see the list of matching records. Remember that you need to enable appropriate access in the Team configuration in order to see that content.
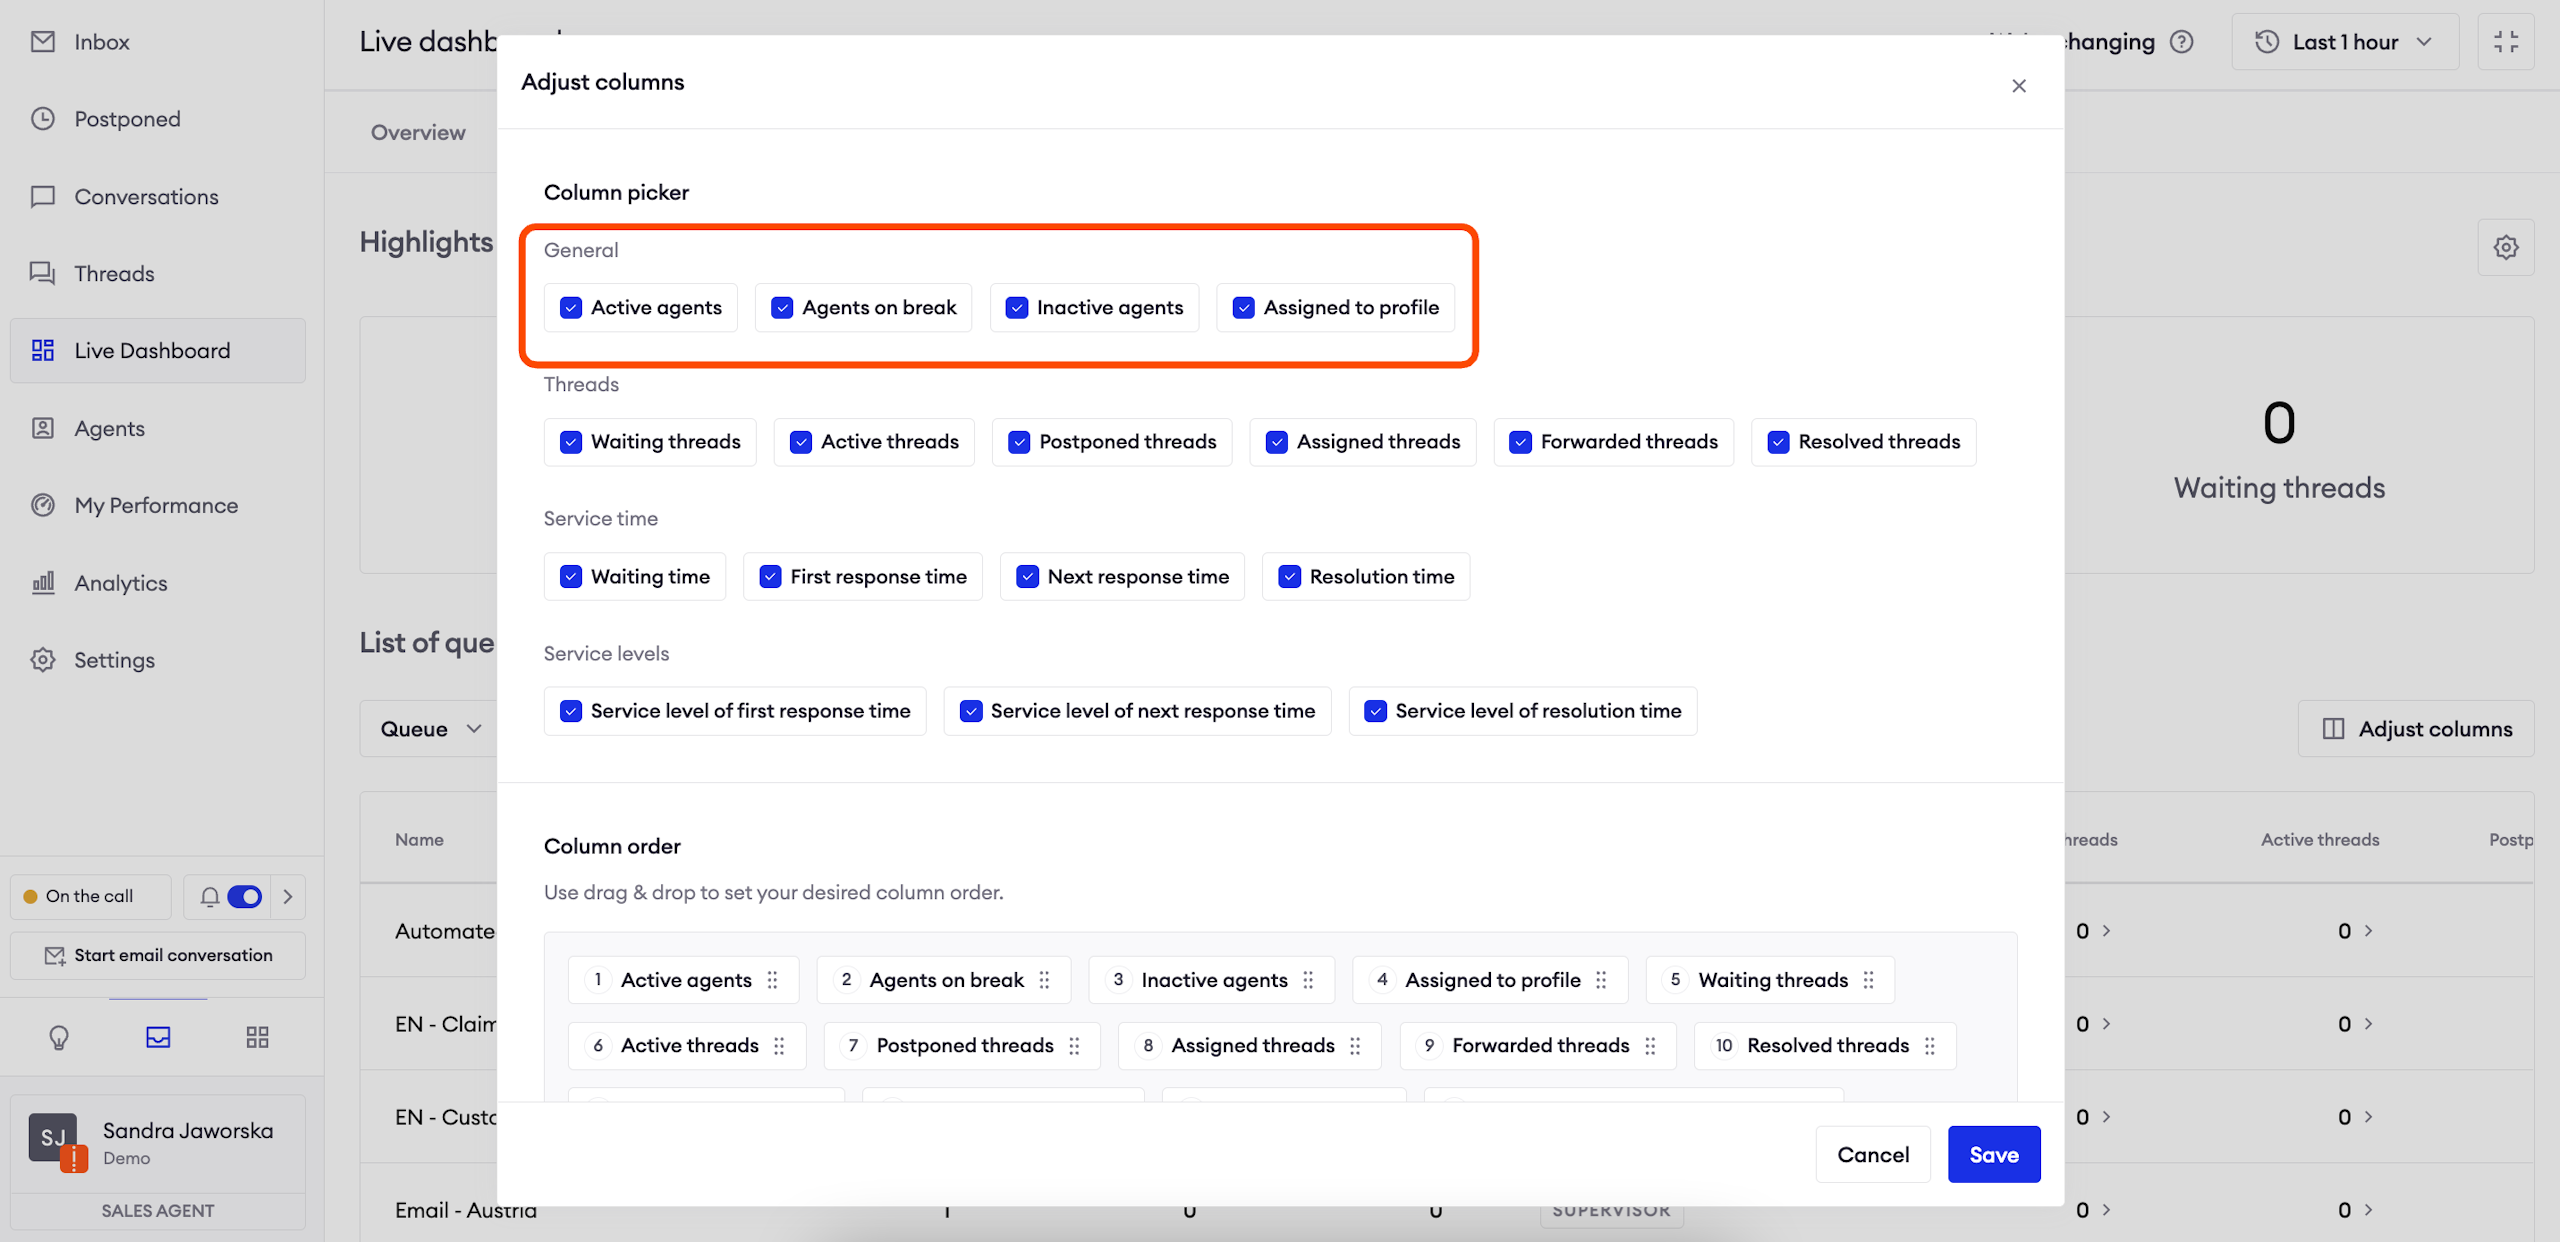
General
Active Agents: the number of Agents in that queue, with active status.
Agents on break: the number of Agents in that queue, with any break status.
Inactive Agents: the number of Agents in that queue, with inactive status.
Assigned to Profile: the list of Profiles to which this queue is assigned.
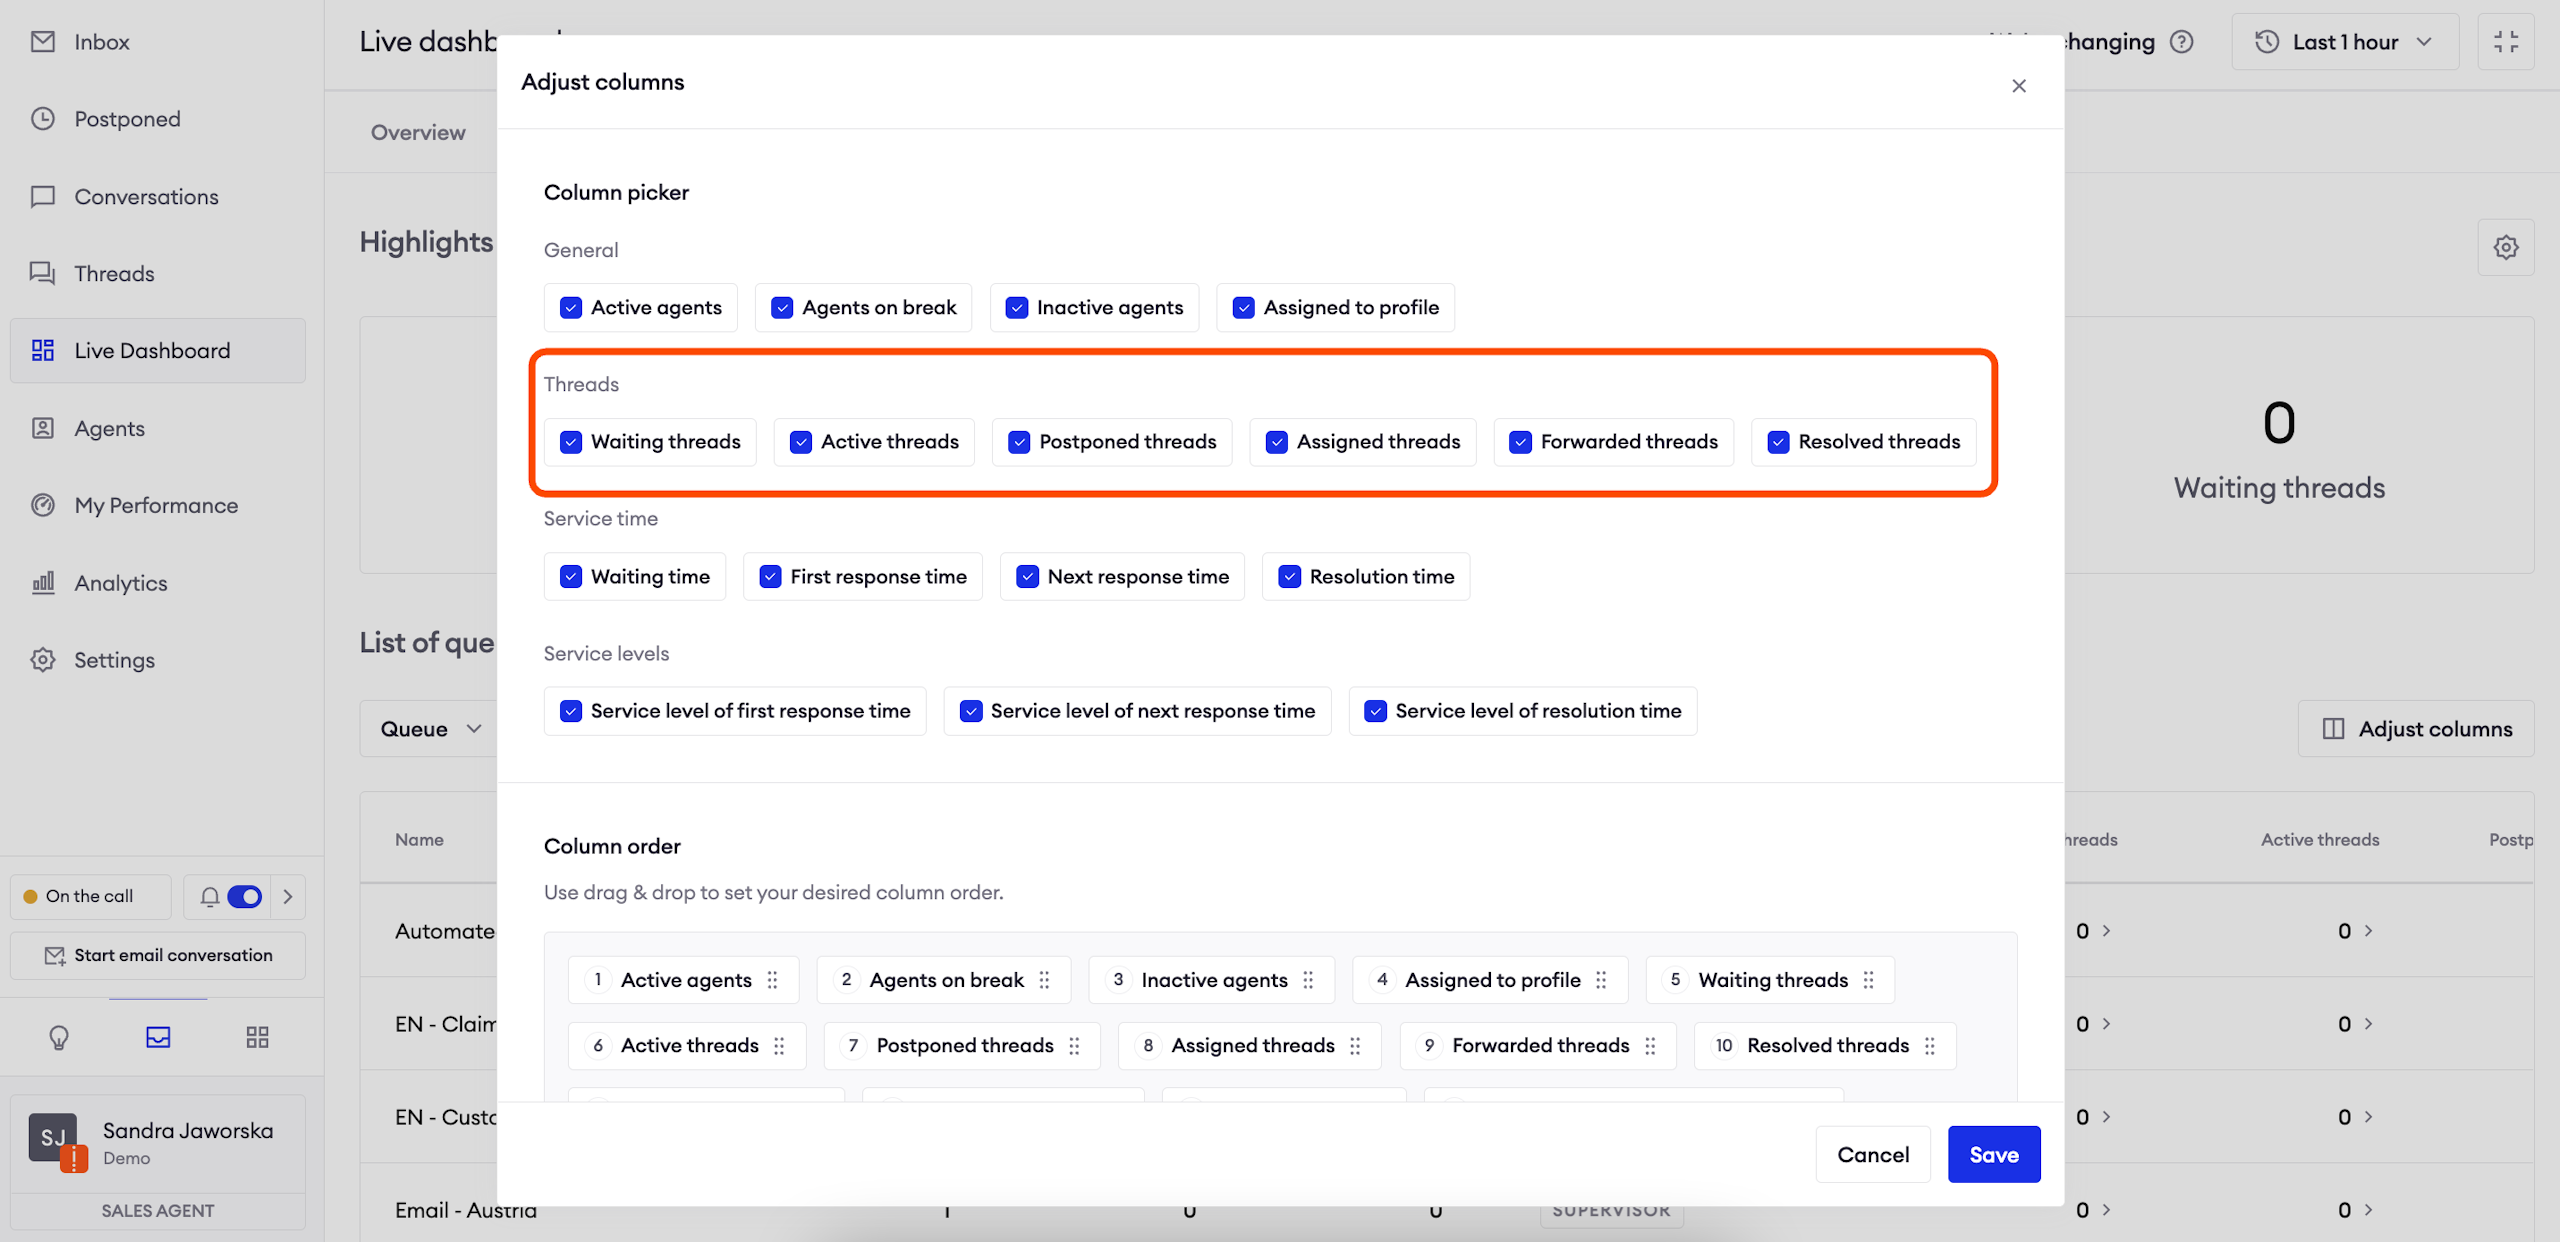
Threads
Waiting threads: the number of threads currently waiting in the queue to be assigned by agents.
Active threads: how many conversations which have not been marked as done are currently in the queue; postponed conversations will count towards these statistics.
Assigned threads: how many threads were assigned in this queue within the selected period; it is different from Active threads because it also counts threads which were passed from this queue to other queues. Mass marked as done threads will be counted towards these statistics.
Forwarded threads: how many threads were forwarded from that queue in the selected period.
Resolved threads: how many threads in this queue were resolved (marked as done) during the selected period; threads resolved by mass mark as done are also counted towards this statistics.
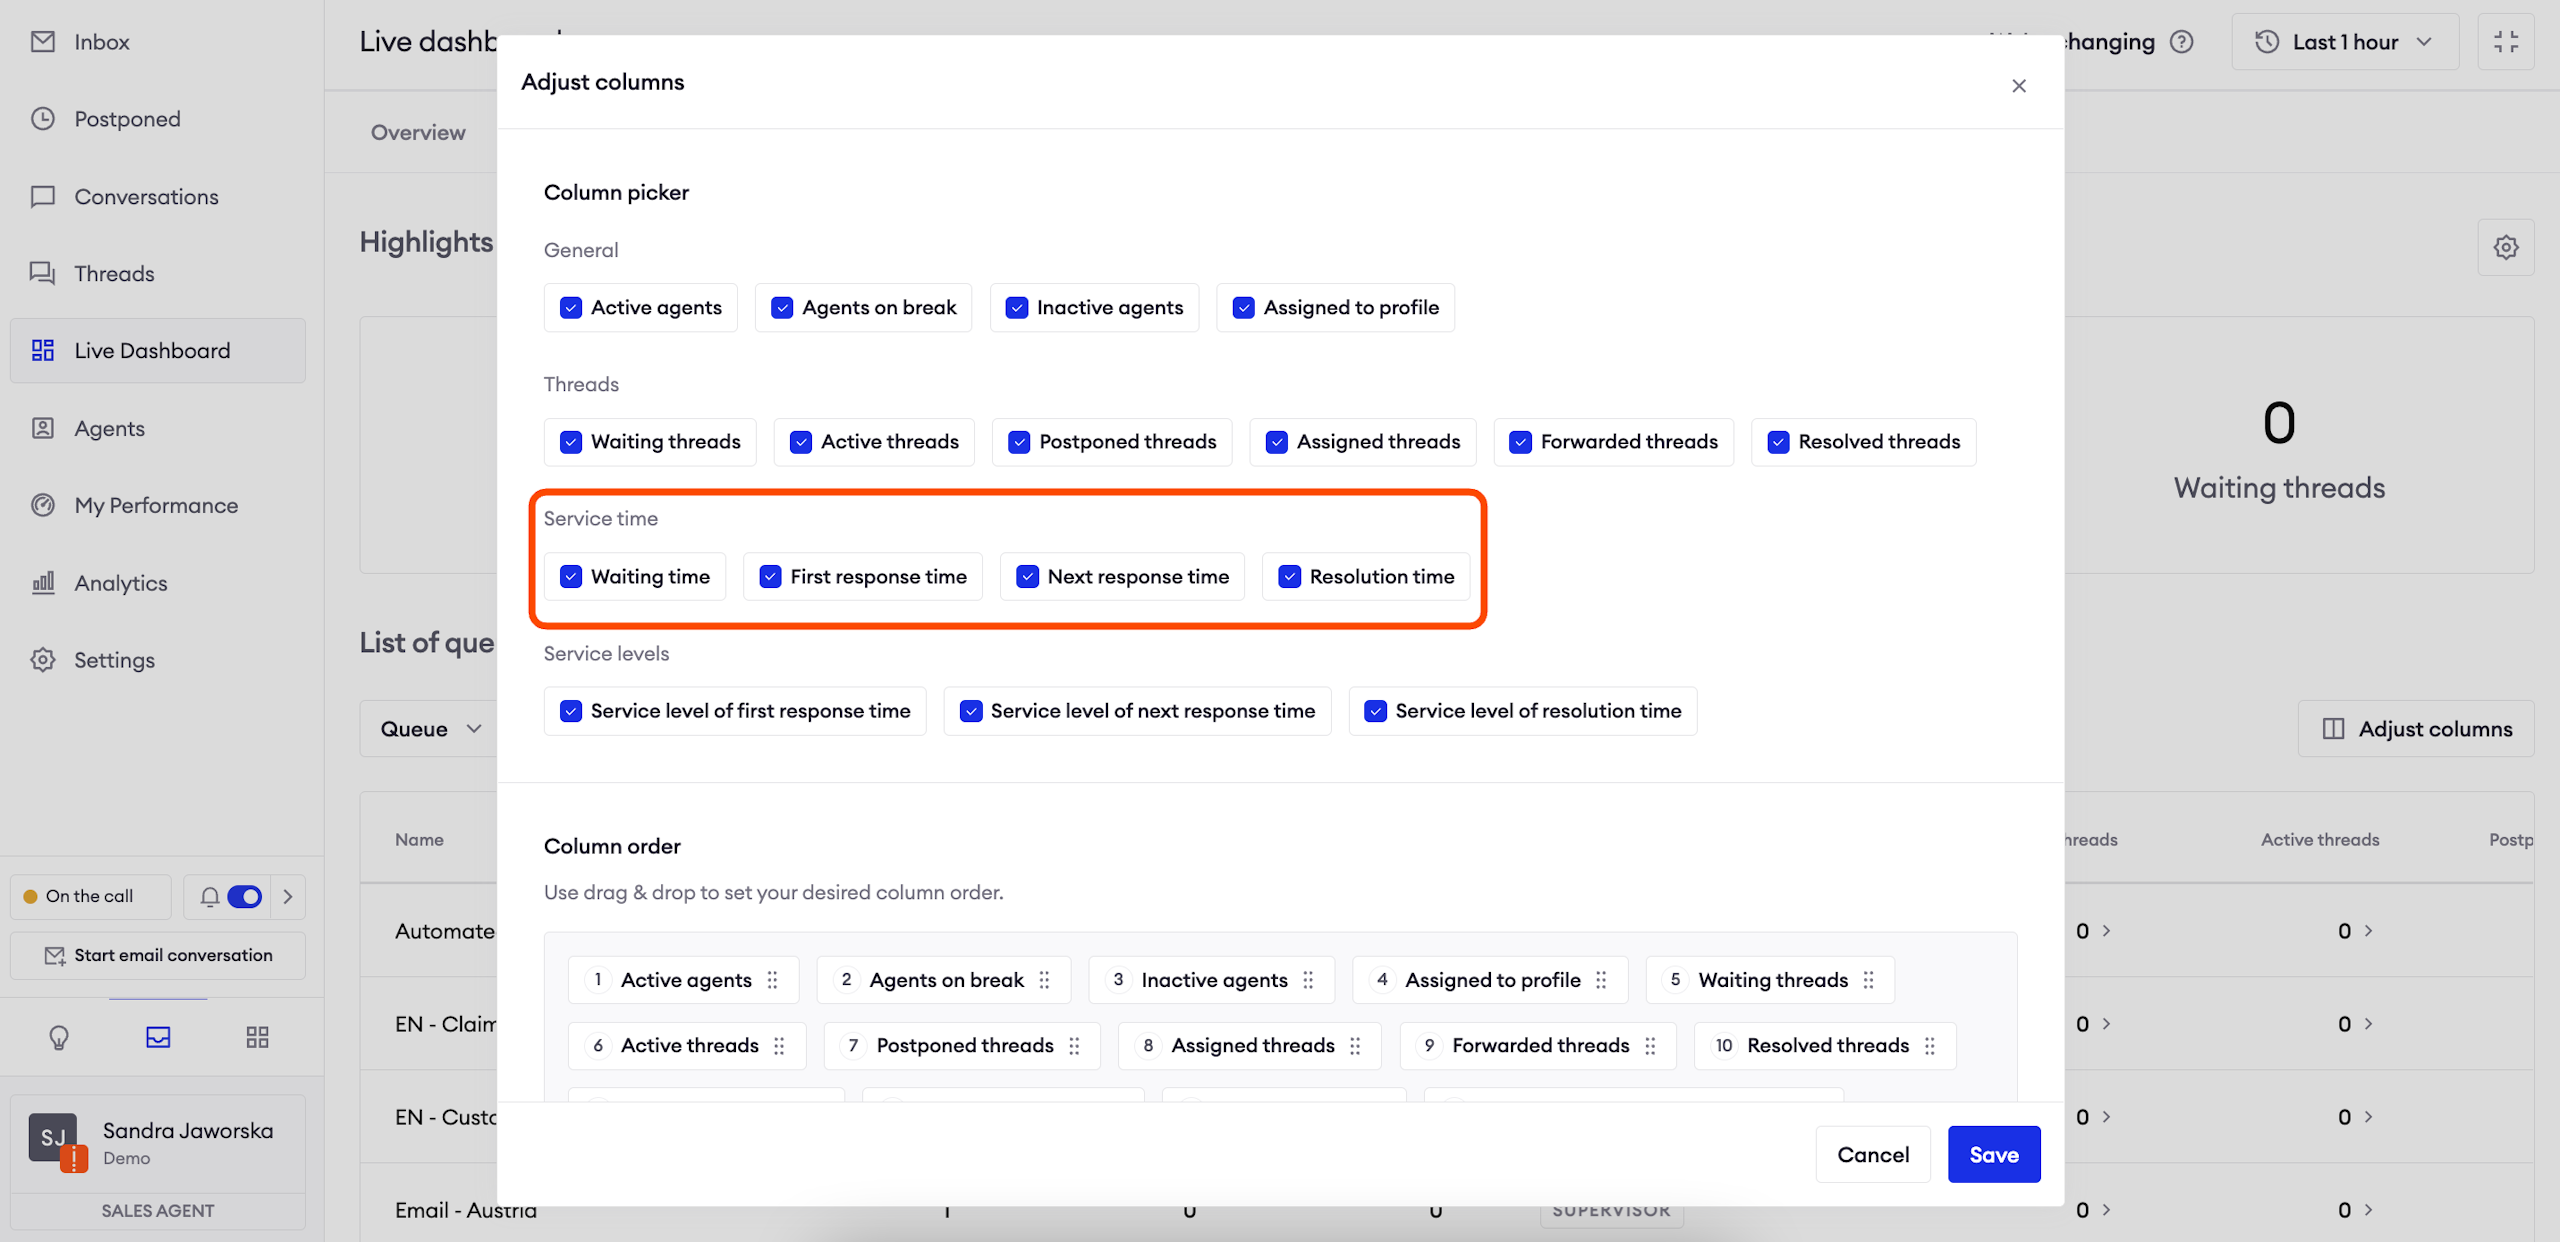
Service time
First response time (FRT): what the average, minimum and maximum first response time for threads in this queue is within the selected timeframe.
- FRT is counted as the time between the moment a chat enters the queue, and the first response an Agent sends in that conversation.
- Average is counted based on all FRTs from the selected period.
Next response time (NRT): average, minimum and maximum time it took agents in that queue to send the next reply to a user.
- NRT is counted as the time between the user’s message and the agent’s reply to that message (excluding first response). We take all next response times in the conversation, count an average and display it as NRT.
- Average is counted based on all NRTs from the selected period.
Resolution time: what is the average, minimum and maximum resolution time in the selected timeframe.
- Resolution time starts the moment the user initiates handover until the agent marks the chat as done; it means that waiting in the queue counts towards resolution time as well.
Waiting time: how much time customers wait before talking to an agent in this queue. Waiting time starts counting when a user is assigned to the queue and finishes when they are assigned to an agent.
Service level
Service level of FRT / NRT / Resolution time: displays the percentage of chats in the selected period which met current SLA values.