Inbox Analytics
What are Inbox Analytics?
Inbox Analytics are a series of dashboards that give you the tools to understand the performance of your business and support team.
Why use Inbox Analytics?
Analytics helps you understand and improve your performance and customer experience. By frequently reviewing analytics, you can expect to learn what types of issues your customers are facing, and how your support team is performing in resolving those issues. Analytics can give you a snapshot of a current point in time, or show you trends in your performance over a time period.
How to access Inbox Analytics?
To access analytics, select Analytics from the main navigation panel of Zowie Inbox, and then select the specific page you'd like to see.
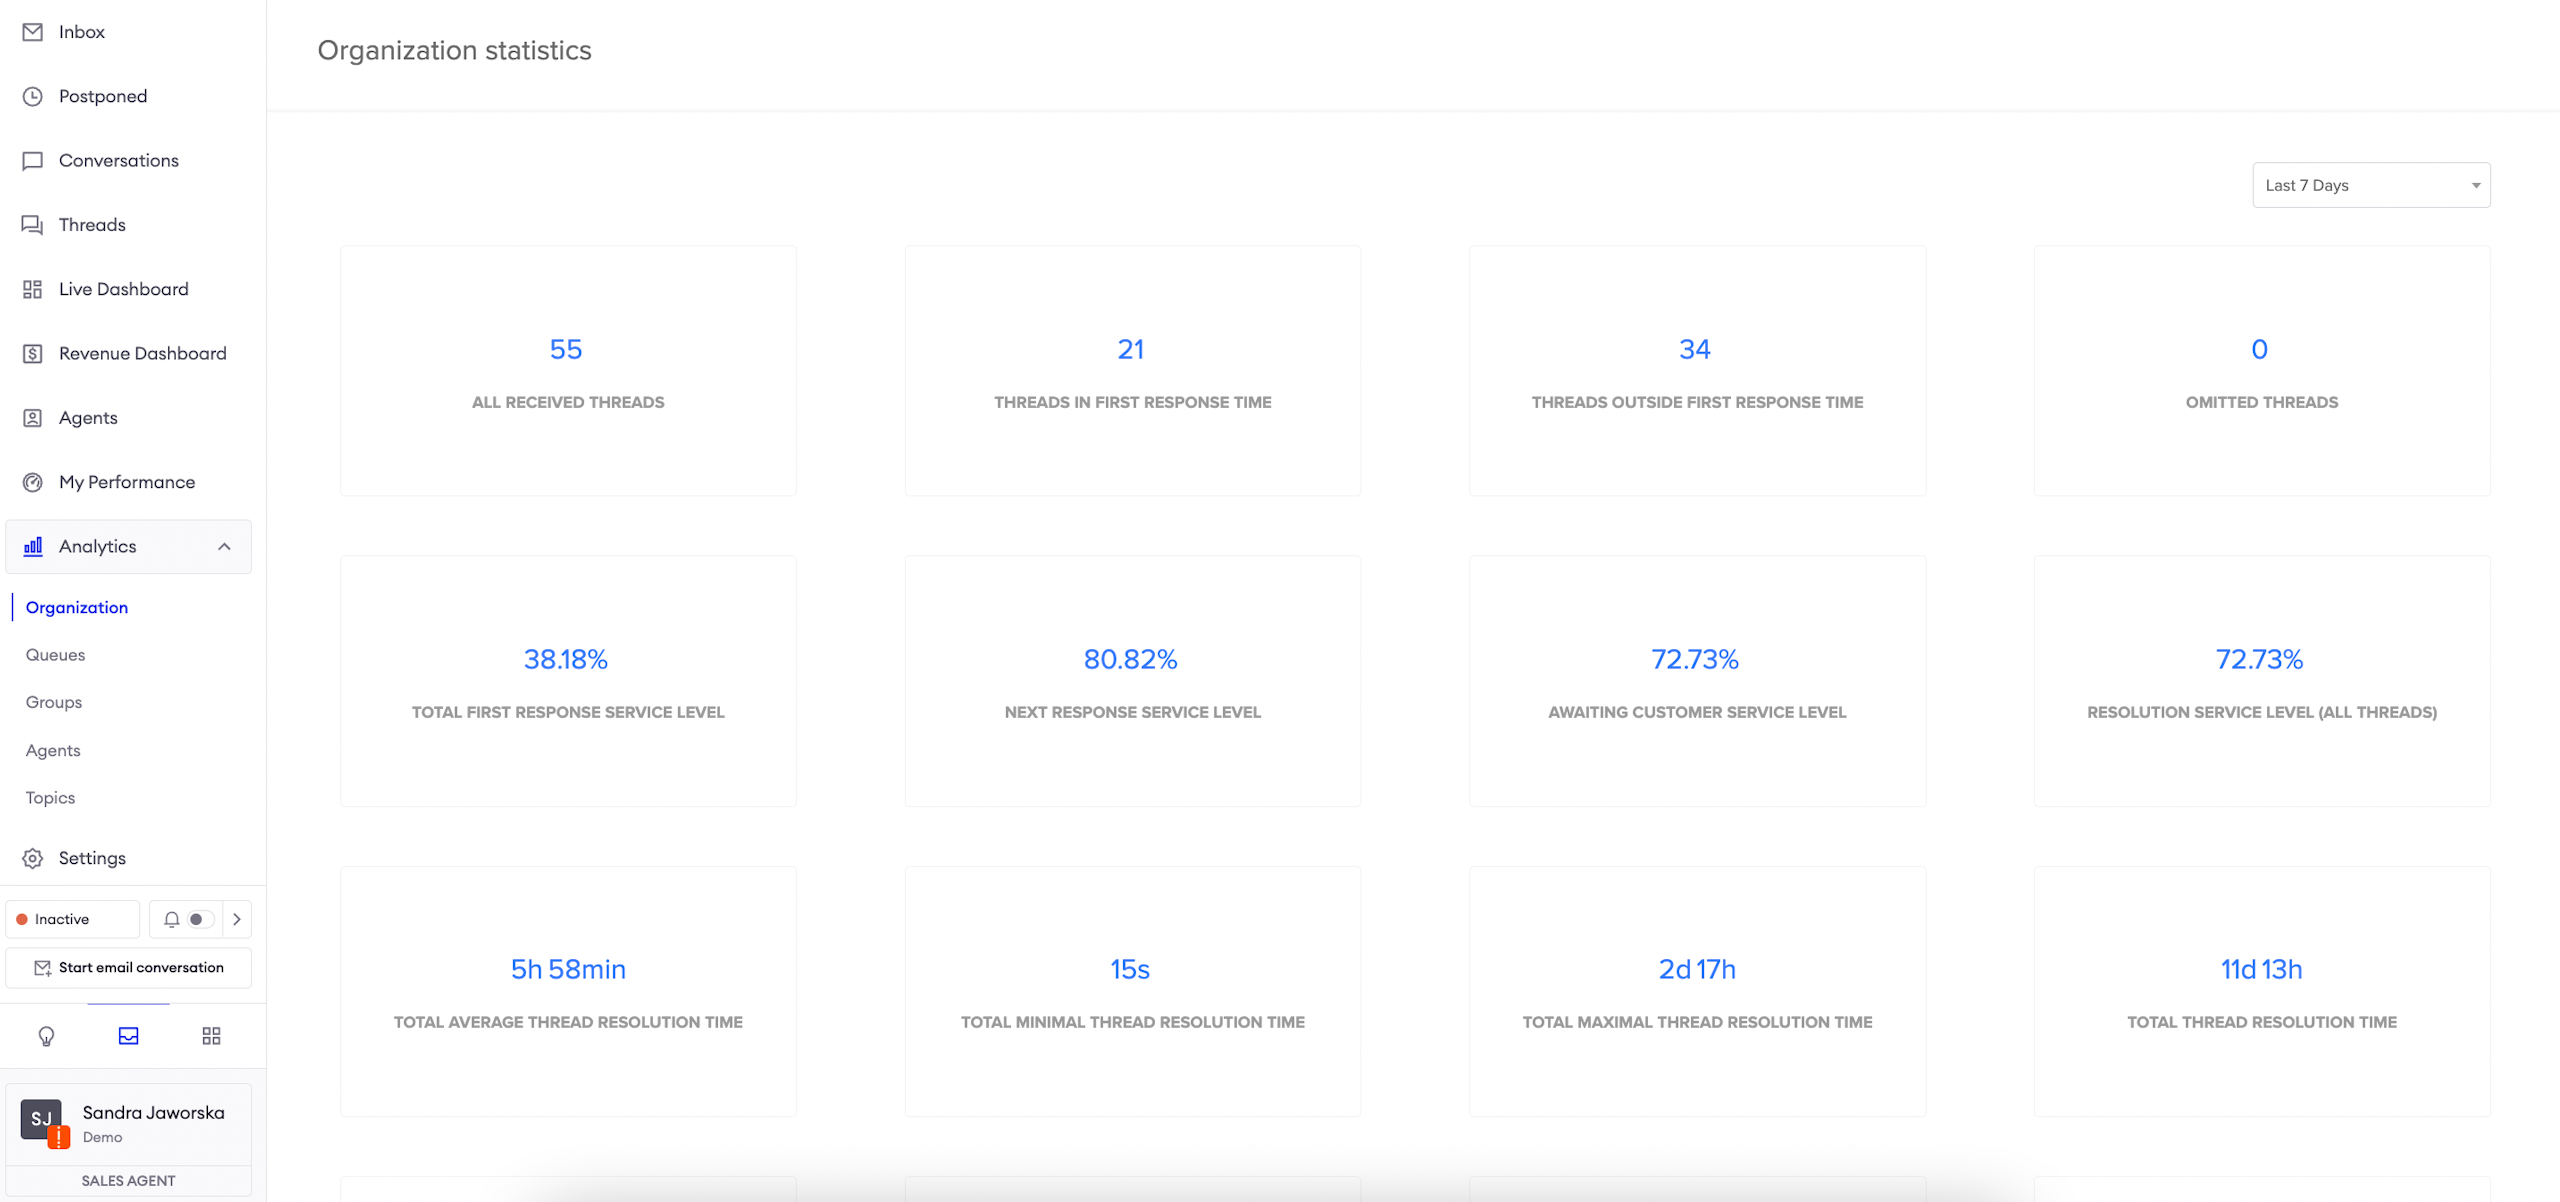
Organization
The Organization statistics view provides you with a variety of data concerning multiple different aspects of your customer team's performance. You can select the period of interest in the top-right corner.
Here you can find the description of the metrics.

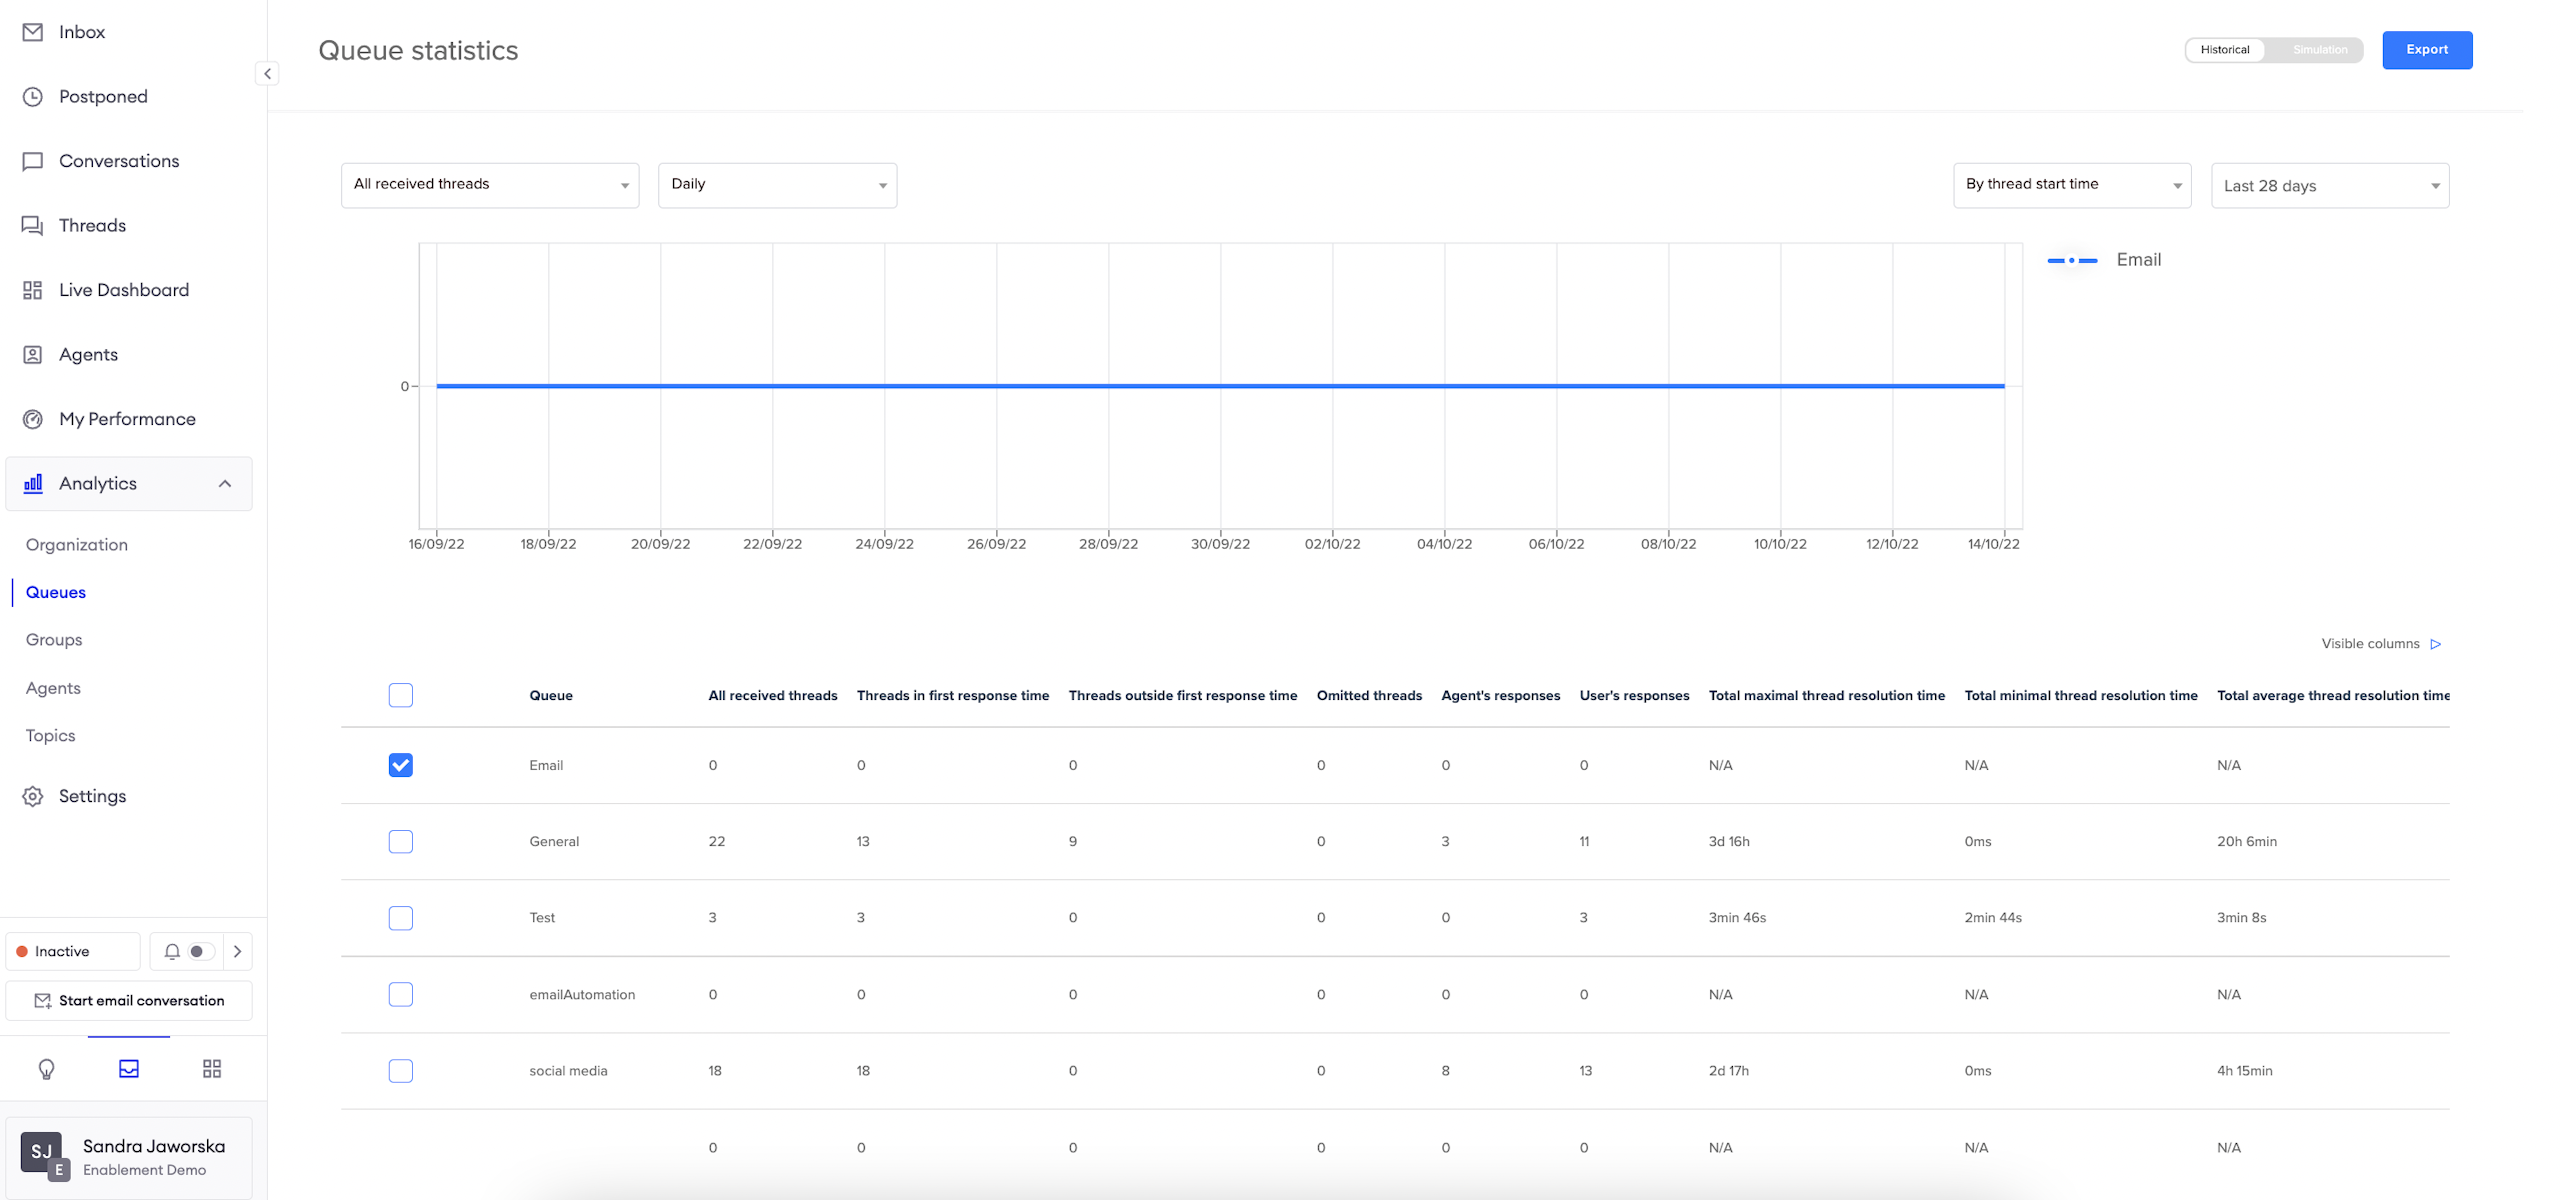
Queues
The Queue view provides you with data regarding the queues. You can select the period of interest in the top-right corner, just below the export button. To the left of the period selection is a switch which allows you to select whether you want to filter the data based on the finish or start date.
Then, you can select the metric that is of interest to you in the top-left corner (for a detailed list of what each metric means, see the Metrics)
The last row in the table is the sum of statistics from groups selected above.
The "Historical" switch allows you to review historical data, while the "Simulation" switch allows you to set the desired service level and see how much will the data change in correspondence to it - for example, if the service level is changed to 5 minutes, you can see what impact will it have on the response time of the agents.
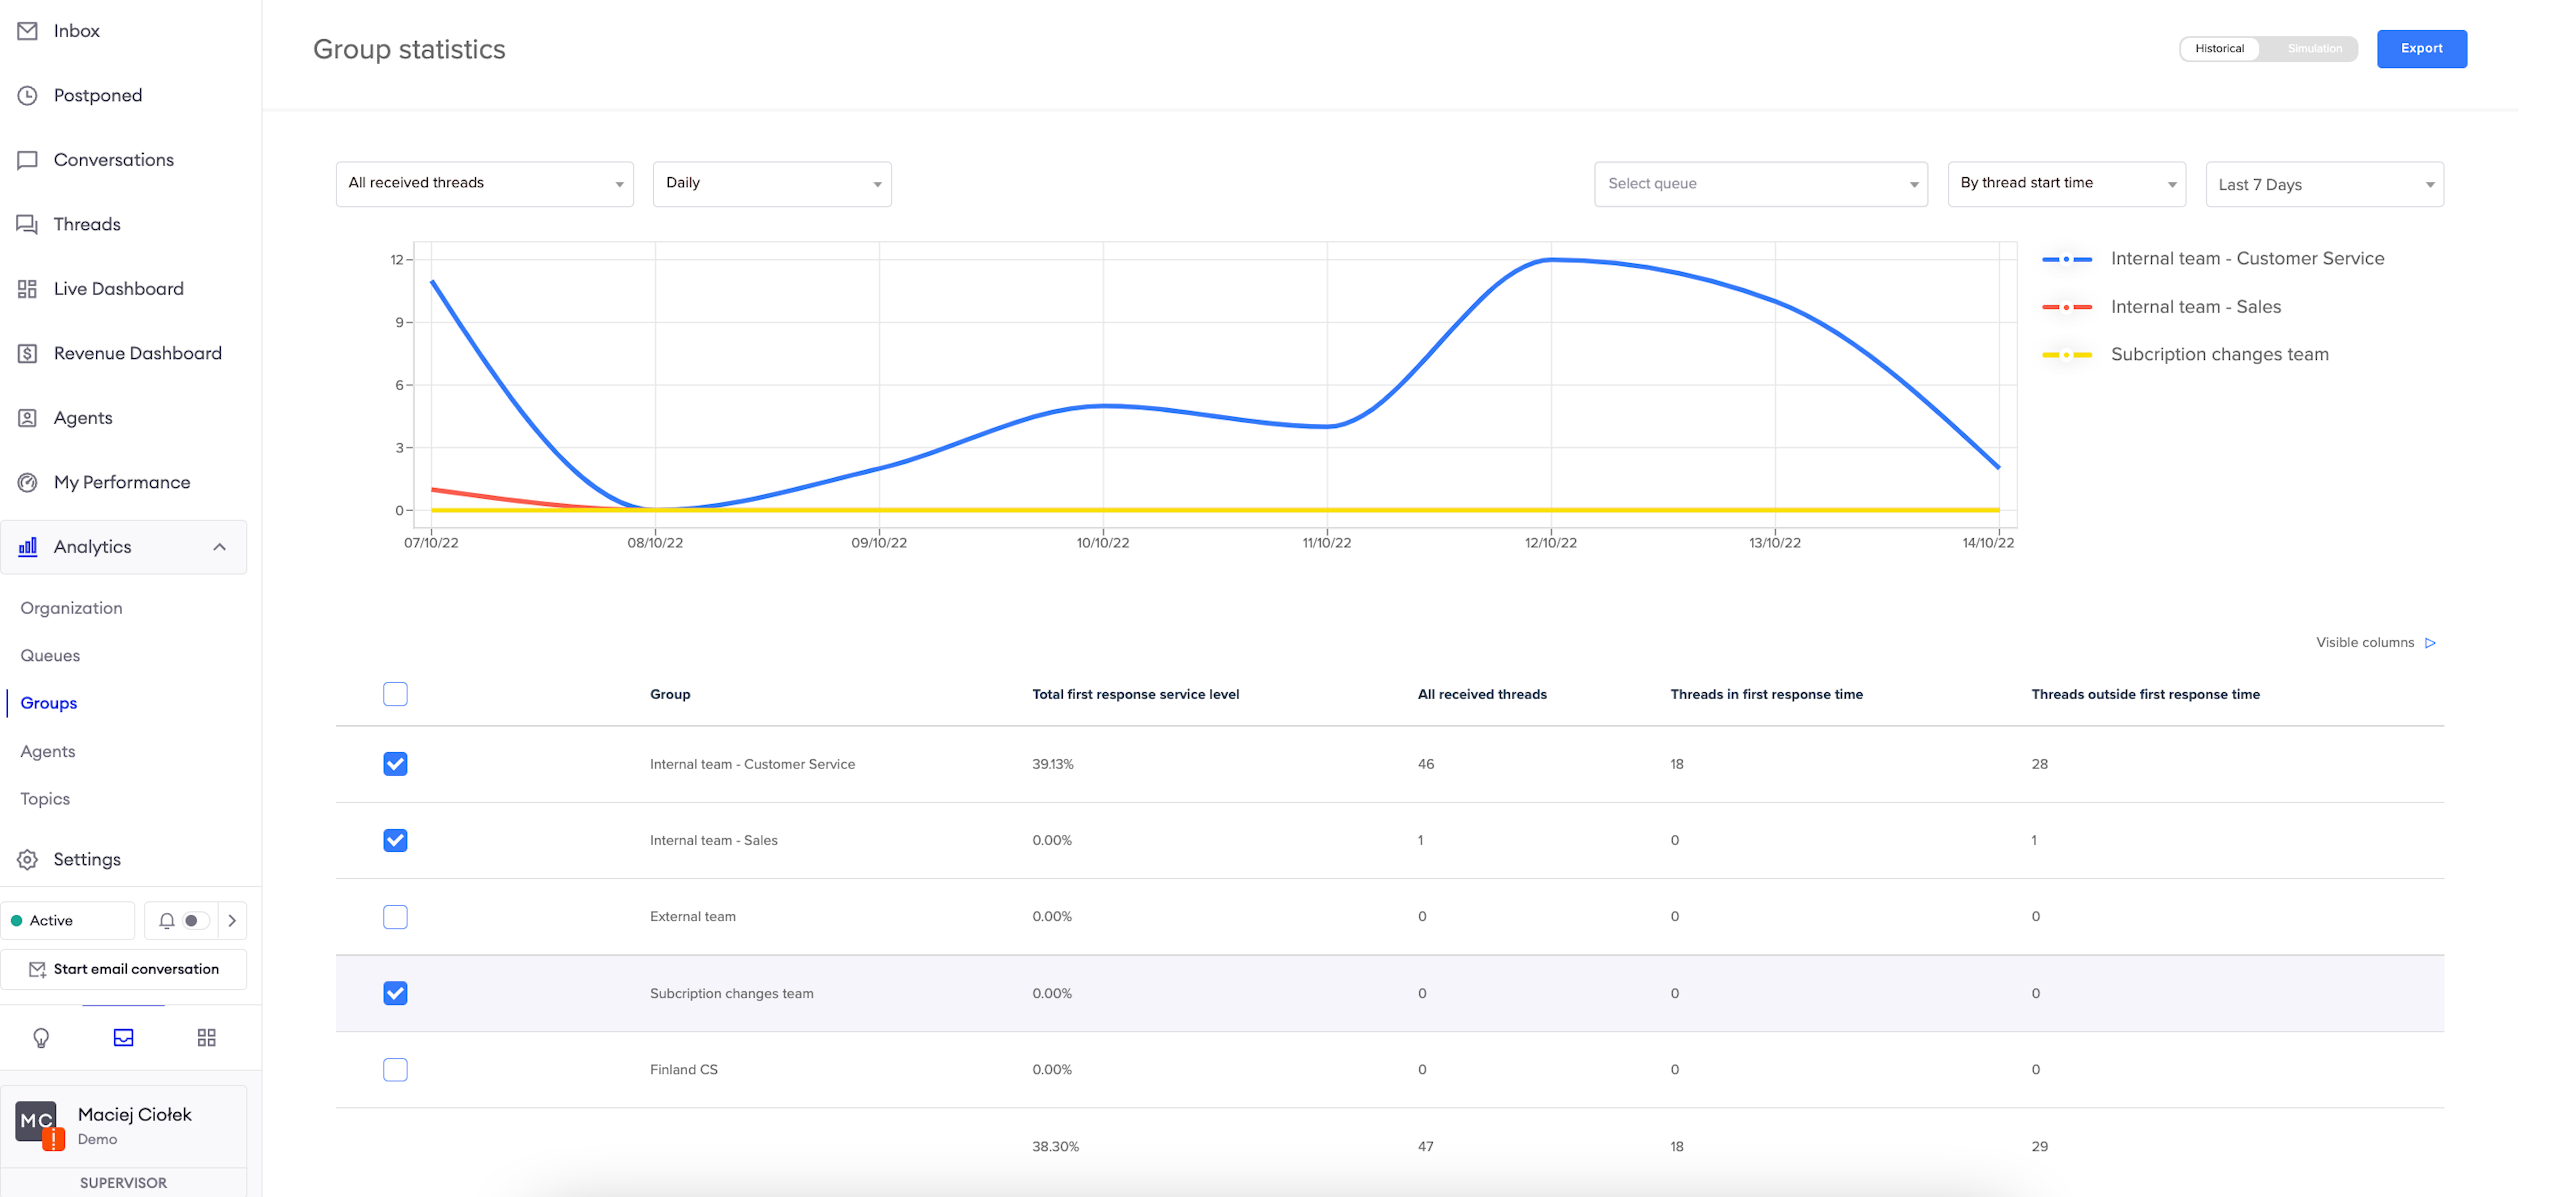
Groups
The Groups view provides you with data regarding the groups. You can select the period of interest in the top-right corner, just below the "Export" button. To the left of the period selection is a switch which allows you to select whether you want to filter the data based on the finish or start date.
Then, you can select the metric that is of interest to you in the top-left corner (for a detailed list of what each metric means, see the Metrics page) and the respective groups on the list below the graph, and it will update accordingly.
The last row in the table is the sum of statistics from groups selected above.
The "Historical" switch allows you to review historical data, while the "Simulation" switch allows you to set the desired service level and see how much will the data change in correspondence to it - for example, if the service level is changed to 5 minutes, you can see what impact will it have on the response time of the agents.
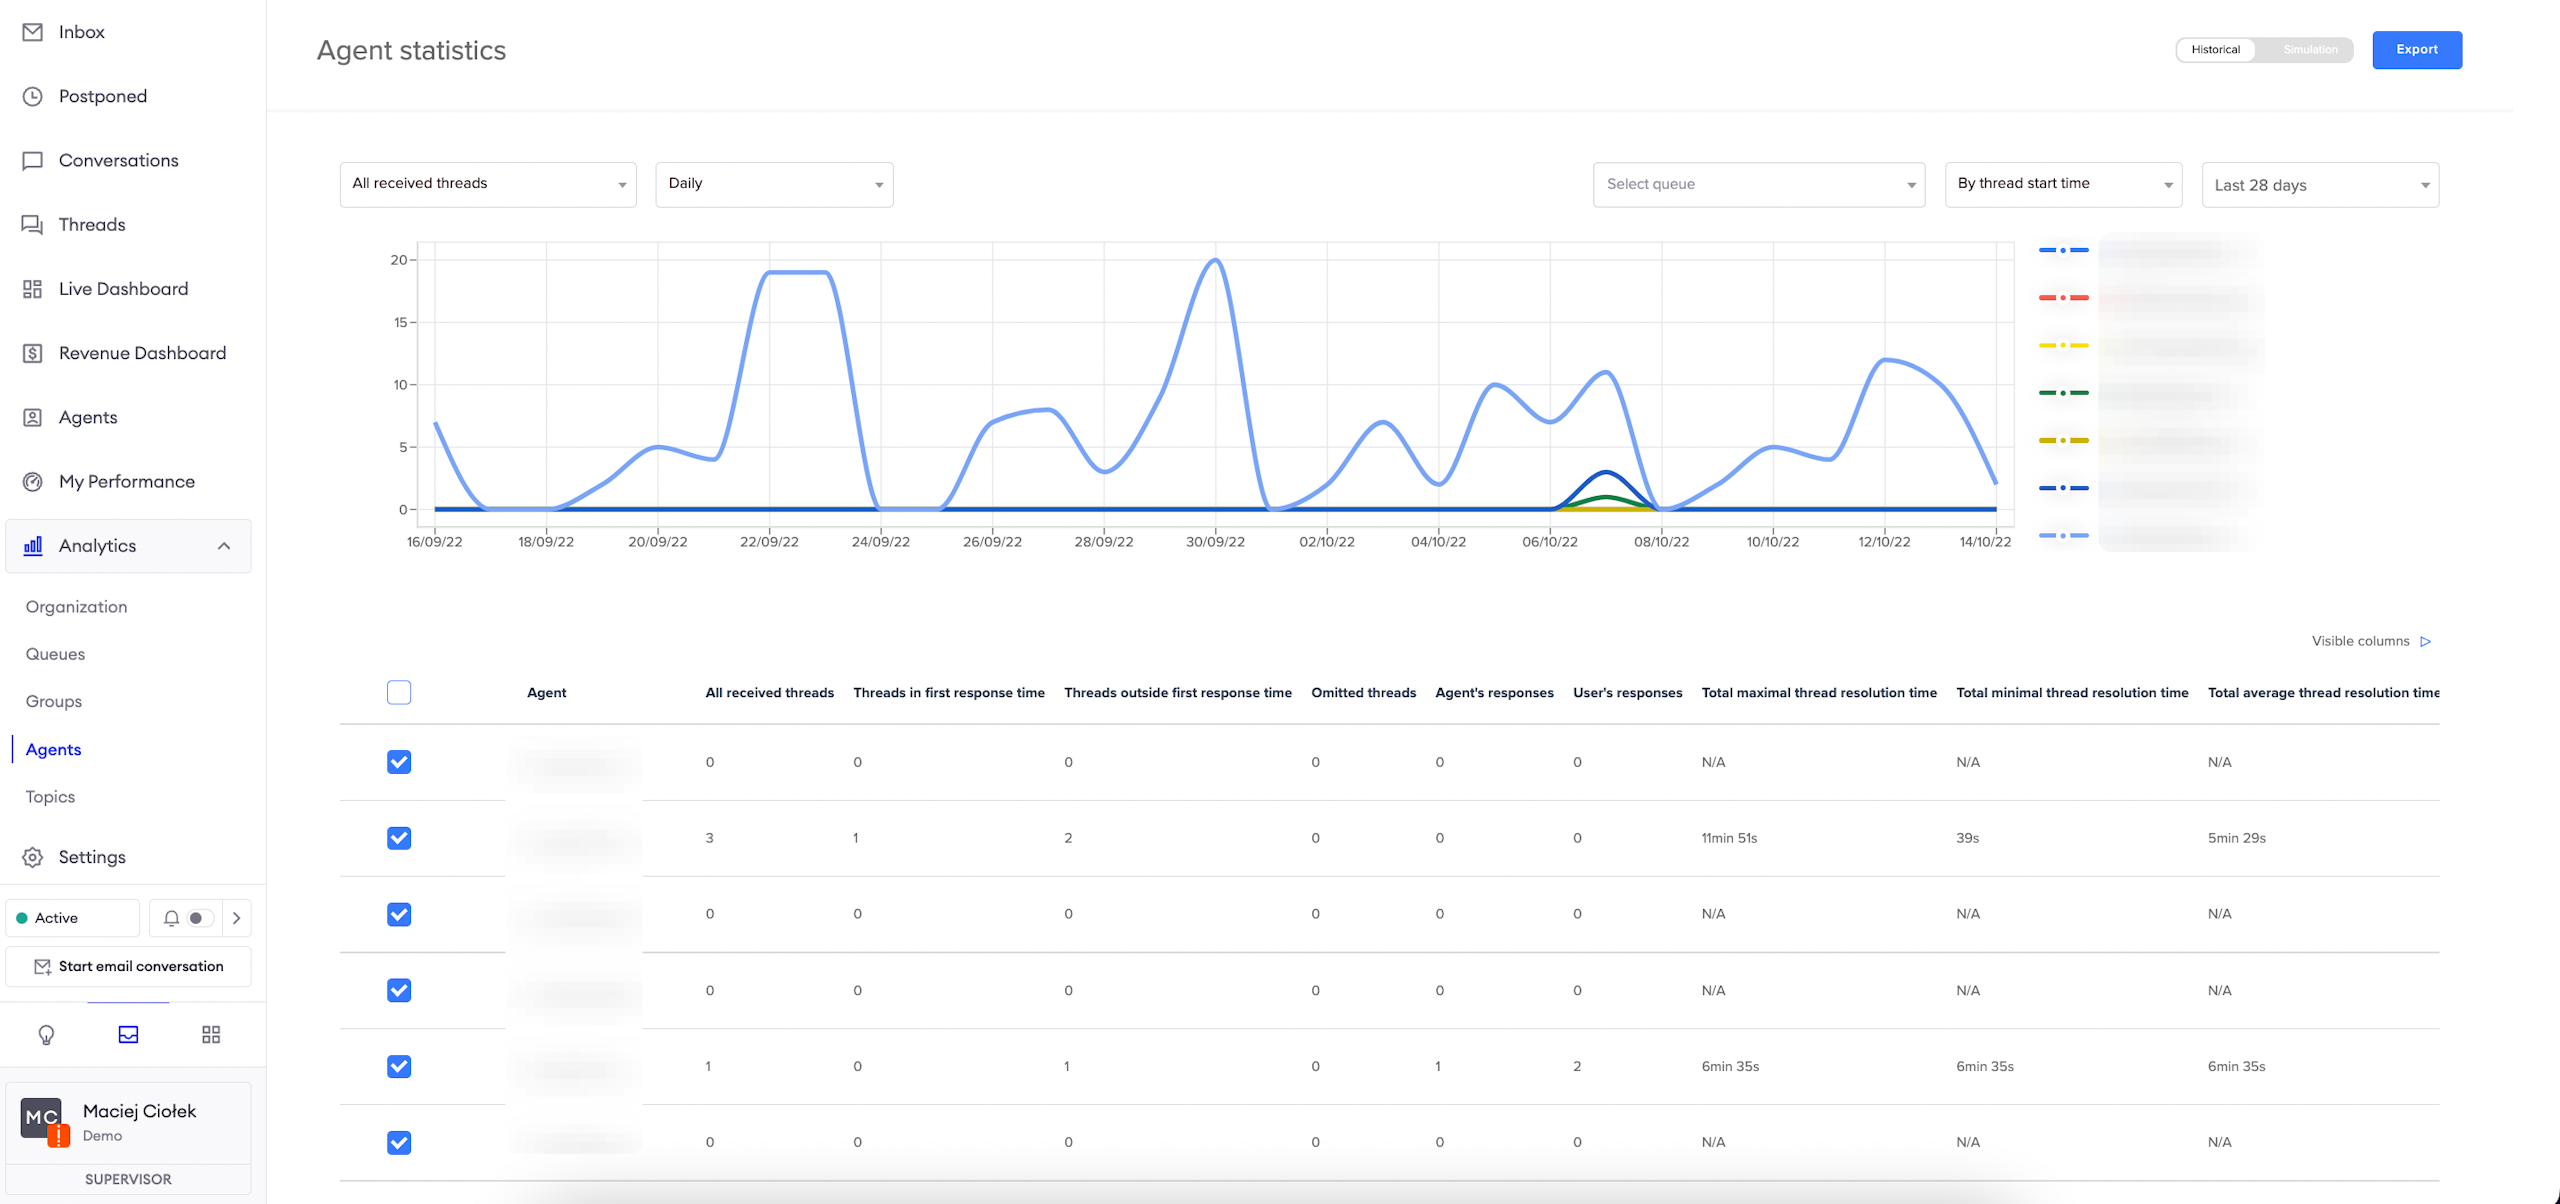
Agents
The Agents view provides you with data regarding your agents. You can select the period of interest in the top-right corner, just below the export button. To the left of the period selection is a switch which allows you to select whether you want to filter the data based on the finish or the start date.
Then, you can select the metric that is of interest to you in the top-left corner (for a detailed list of what each metric means, see the Metrics page) and the respective agents on the list below the graph, and it will update accordingly.
The last row in the table is the sum of statistics from groups selected above.
The "Historical" switch allows you to review historical data, while the "Simulation" switch allows you to set the desired service level and see how much will the data change in correspondence to it - for example, if the service level is changed to 5 minutes, you can see what impact will it have on the response time of the agents.
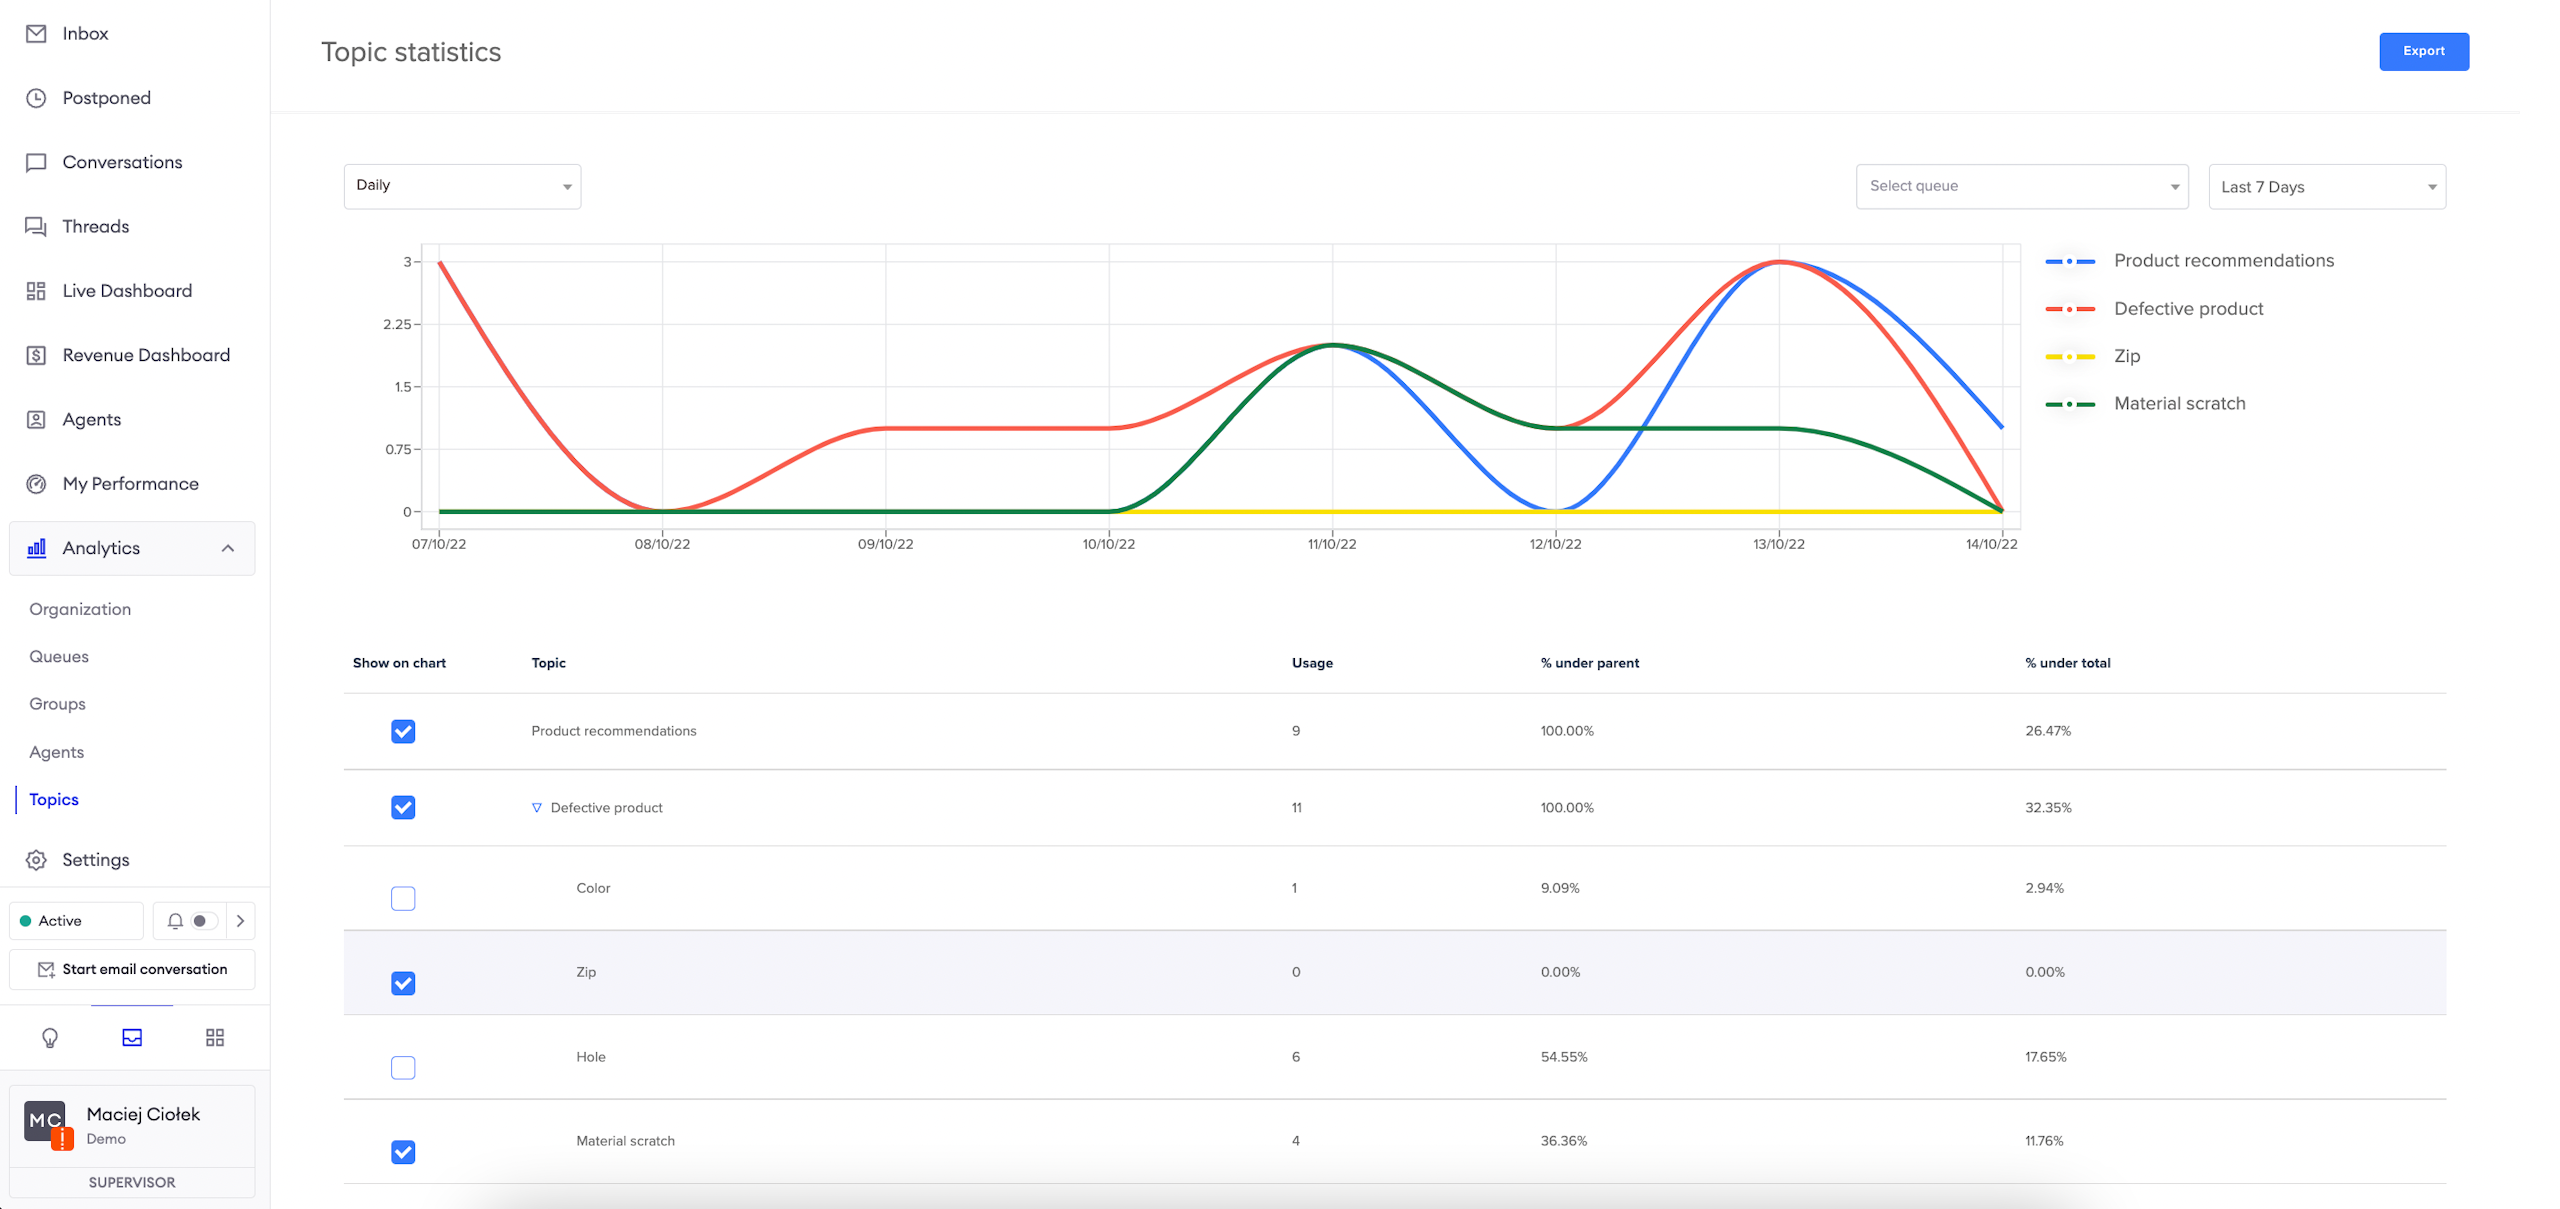
Topics
The Topics view provides you with data regarding the topics in your Inbox configuration. You can select the period of interest in the top-right corner, just below the export button. To the left of the period selection is a switch which allows you to select the queue that is of interest to you.